1982 Grampian Regional Council election
| ||||||||||||||||||||||||||||||||||||||||||||||||||||||||||||||||||||
All 54 seats to Grampian Regional Council 28 seats needed for a majority | ||||||||||||||||||||||||||||||||||||||||||||||||||||||||||||||||||||
|---|---|---|---|---|---|---|---|---|---|---|---|---|---|---|---|---|---|---|---|---|---|---|---|---|---|---|---|---|---|---|---|---|---|---|---|---|---|---|---|---|---|---|---|---|---|---|---|---|---|---|---|---|---|---|---|---|---|---|---|---|---|---|---|---|---|---|---|---|
| ||||||||||||||||||||||||||||||||||||||||||||||||||||||||||||||||||||
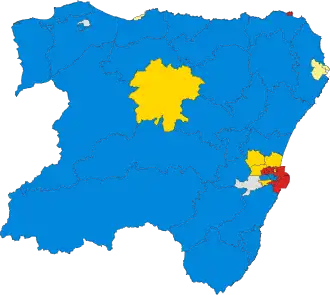 The 54 single member wards | ||||||||||||||||||||||||||||||||||||||||||||||||||||||||||||||||||||
The 1982 election to the Grampian Regional Council took place on 6 May 1982, as part of the wider 1982 Scottish regional elections. The election saw the Conservatives maintaining their dominance of the 54 seat Council, albeit with a reduced presence.[1]
Results
| Party | Seats | Gains | Losses | Net gain/loss | Seats % | Votes % | Votes | +/− | |
|---|---|---|---|---|---|---|---|---|---|
| Conservative | 28 | - | - | 51.9 | 40.4 | 41,390 | |||
| Labour | 15 | - | - | 27.8 | 27.3 | 27,940 | |||
| Alliance | 6 | - | - | 11.1 | 17.0 | 17,359 | |||
| SNP | 3 | - | - | 5.6 | 11.4 | 11,646 | |||
| Independent | 2 | - | - | 3.7 | 3.9 | 3,967 | |||
Ward results
References
- ^ "The Results". The Glasgow Herald. 8 May 1982. p. 12.
- ^ pp.56-59
| Aberdeen Corporation |
|
|---|---|
| City of Aberdeen District Council | |
| Aberdeen City Council | |
| Grampian Regional Council | |
| London boroughs |
|
|---|---|
| Metropolitan boroughs |
|
| District councils (England) |
|
| Regional councils (Scotland) | |