1992 Moray District Council election
 | |||||||||||||||||||||||||||||||||||||||||||||||||||||||||||
All 18 seats to Moray District Council 10 seats needed for a majority | |||||||||||||||||||||||||||||||||||||||||||||||||||||||||||
|---|---|---|---|---|---|---|---|---|---|---|---|---|---|---|---|---|---|---|---|---|---|---|---|---|---|---|---|---|---|---|---|---|---|---|---|---|---|---|---|---|---|---|---|---|---|---|---|---|---|---|---|---|---|---|---|---|---|---|---|
| |||||||||||||||||||||||||||||||||||||||||||||||||||||||||||
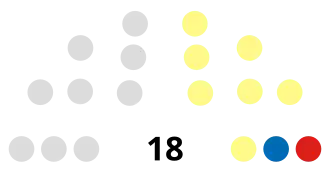 Composition of District Council after the election | |||||||||||||||||||||||||||||||||||||||||||||||||||||||||||
Elections to Moray District Council were held on 7 May 1992, the same day as the other Scottish local government elections. Each ward elected a single member using the first-past-the-post voting system.
Background
As in this election to the Moray District Council, the Independent group at the 1988 election also took 9 seats, with the SNP a close second at 7. Labour held the remaining 2 seats.
| Party | Seats | Vote share |
|---|---|---|
| Independent | 9 | 36.8% |
| SNP | 7 | 45.4% |
| Labour | 2 | 8.4% |
Source:[1]
Results
| Party | Seats | Gains | Losses | Net gain/loss | Seats % | Votes % | Votes | +/− | |
|---|---|---|---|---|---|---|---|---|---|
| Independent | 9 | 2 | 2 | 50.0 | 35.7 | 8,853 | |||
| SNP | 7 | 2 | 2 | 38.9 | 46.1 | 11,454 | |||
| Conservative | 1 | 1 | 0 | 5.6 | 10.1 | 2,508 | |||
| Labour | 1 | 0 | 1 | 5.6 | 4.1 | 1,004 | |||
| Liberal Democrats | 0 | 0 | 0 | 0.0 | 4.2 | 1,031 | |||
Source:[2]
Ward results
Bishopmill
| Party | Candidate | Votes | % | |
|---|---|---|---|---|
| Independent | G MacKenzie | 632 | 54.1 | |
| SNP | R Pattie | 532 | 45.5 | |
| Majority | 100 | 8.6 | ||
| Turnout | 1,168 | 32.1 | ||
| Independent gain from Labour | ||||
Cathedral
| Party | Candidate | Votes | % | |
|---|---|---|---|---|
| Labour | A Farqhuarson (Incumbent) | 583 | 44.2 | |
| SNP | E Hardie | 385 | 29.2 | |
| Conservative | G Rogers | 349 | 26.4 | |
| Majority | 198 | 15.0 | ||
| Turnout | 1,320 | 34.6 | ||
| Labour hold | ||||
New Elgin
| Party | Candidate | Votes | % | |
|---|---|---|---|---|
| SNP | M Anderson | 439 | 41.5 | |
| Conservative | D McGettrick | 318 | 30.0 | |
| Labour | A Wood | 251 | 23.7 | |
| Liberal Democrats | J Johnstone | 50 | 4.7 | |
| Majority | 121 | 11.5 | ||
| Turnout | 1,059 | 30.8 | ||
| SNP gain from Independent | ||||
Central West
| Party | Candidate | Votes | % | |
|---|---|---|---|---|
| Independent | J Proctor (Incumbent) | 866 | 55.4 | |
| SNP | R Burns | 448 | 28.7 | |
| Labour | L Easton | 170 | 10.9 | |
| Liberal Democrats | W Nelson | 75 | 4.8 | |
| Majority | 418 | 26.7 | ||
| Turnout | 1,559 | 39.7 | ||
| Independent hold | ||||
Forres
| Party | Candidate | Votes | % | |
|---|---|---|---|---|
| SNP | H Cumiskie (Incumbent) | 898 | 54.5 | |
| Independent | C White | 624 | 37.9 | |
| Liberal Democrats | M McLintock | 124 | 7.5 | |
| Majority | 274 | 16.6 | ||
| Turnout | 1,647 | 36.5 | ||
| SNP hold | ||||
Findhorn Valley
| Party | Candidate | Votes | % | |
|---|---|---|---|---|
| Independent | W Swanson | 840 | 55.3 | |
| SNP | R Laing (Incumbent) | 732 | 46.4 | |
| Majority | 108 | 6.9 | ||
| Turnout | 1,577 | 33.2 | ||
| Independent gain from SNP | ||||
Laich
| Party | Candidate | Votes | % | |
|---|---|---|---|---|
| Conservative | D Thompson | 875 | 57.2 | |
| SNP | C Scaife (Incumbent) | 650 | 42.5 | |
| Majority | 225 | 14.7 | ||
| Turnout | 1,531 | 37.6 | ||
| Conservative gain from SNP | ||||
Lossiemouth
| Party | Candidate | Votes | % | |
|---|---|---|---|---|
| SNP | A Fleming | 1,151 | 65.2 | |
| Conservative | R Conway | 521 | 29.5 | |
| Liberal Democrats | A Blumner | 88 | 5.0 | |
| Majority | 630 | 35.7 | ||
| Turnout | 1,765 | 43.0 | ||
| SNP hold | ||||
Heldon
| Party | Candidate | Votes | % | |
|---|---|---|---|---|
| Independent | I Lawson (Incumbent) | 615 | 62.3 | |
| SNP | S Ewing | 297 | 30.1 | |
| Liberal Democrats | E Nelson | 73 | 7.4 | |
| Majority | 318 | 32.2 | ||
| Turnout | 987 | 36.2 | ||
| Independent hold | ||||
Innes
| Party | Candidate | Votes | % | |
|---|---|---|---|---|
| Independent | J Shaw (Incumbent) | 977 | 66.3 | |
| SNP | I Taylor | 492 | 33.4 | |
| Majority | 485 | 32.9 | ||
| Turnout | 1,473 | 37.4 | ||
| Independent hold | ||||
Buckie West
| Party | Candidate | Votes | % | |
|---|---|---|---|---|
| SNP | W Jappy (Incumbent) | 975 | 70.2 | |
| Independent | E Scott | 409 | 29.4 | |
| Majority | 566 | 40.8 | ||
| Turnout | 1,389 | 42.1 | ||
| SNP hold | ||||
Buckie East
| Party | Candidate | Votes | % | |
|---|---|---|---|---|
| SNP | S Longmore | 930 | 77.4 | |
| Independent | H Watt | 270 | 22.5 | |
| Majority | 660 | 54.9 | ||
| Turnout | 1,202 | 37.9 | ||
| SNP hold | ||||
Rathford
| Party | Candidate | Votes | % | |
|---|---|---|---|---|
| Independent | J Wilson | 784 | 57.4 | |
| SNP | M Marshall | 580 | 42.5 | |
| Majority | 204 | 14.9 | ||
| Turnout | 1,366 | 39.8 | ||
| Independent hold | ||||
Lennox
| Party | Candidate | Votes | % | |
|---|---|---|---|---|
| SNP | T Howe (Incumbent) | 802 | 56.2 | |
| Liberal Democrats | D Cameron | 621 | 43.5 | |
| Majority | 181 | 12.7 | ||
| Turnout | 1,427 | 47.6 | ||
| SNP hold | ||||
Keith
| Party | Candidate | Votes | % | |
|---|---|---|---|---|
| Independent | L Mann (Incumbent) | 1,132 | 66.4 | |
| SNP | M Barr | 572 | 33.5 | |
| Majority | 560 | 32.9 | ||
| Turnout | 1,706 | 49.1 | ||
| Independent hold | ||||
Strathisla
| Party | Candidate | Votes | % | |
|---|---|---|---|---|
| Independent | M Davidson | 537 | 56.1 | |
| SNP | D Barr | 421 | 43.9 | |
| Majority | 116 | 12.2 | ||
| Turnout | 958 | 37.1 | ||
| Independent hold | ||||
Speyside
| Party | Candidate | Votes | % | |
|---|---|---|---|---|
| Independent | E Aldridge (Incumbent) | 1,167 | 71.3 | |
| SNP | G Scott | 467 | 28.5 | |
| Majority | 700 | 42.8 | ||
| Turnout | 1,636 | 49.4 | ||
| Independent hold | ||||
Glenlivet
| Party | Candidate | Votes | % | |
|---|---|---|---|---|
| SNP | A Scott | 683 | 60.5 | |
| Conservative | A Dean | 445 | 39.4 | |
| Majority | 238 | 21.1 | ||
| Turnout | 1,129 | 41.1 | ||
| SNP gain from Independent | ||||
References
- ^ "Scottish District Elections 1988" (PDF). Elections Centre. Retrieved 11 July 2024.
- ^ "Scottish District Elections 1992" (PDF). Elections Centre. Retrieved 11 July 2024.
| Metropolitan boroughs |
|
|---|---|
| District councils (England) |
|
| District councils (Scotland) |
|
| |