1987 Chester City Council election
| |||||||||||||||||||||||||||||||||||||||||||||||||||||||||||||||||
21 out of 60 seats to Chester City Council 31 seats needed for a majority | |||||||||||||||||||||||||||||||||||||||||||||||||||||||||||||||||
|---|---|---|---|---|---|---|---|---|---|---|---|---|---|---|---|---|---|---|---|---|---|---|---|---|---|---|---|---|---|---|---|---|---|---|---|---|---|---|---|---|---|---|---|---|---|---|---|---|---|---|---|---|---|---|---|---|---|---|---|---|---|---|---|---|---|
| |||||||||||||||||||||||||||||||||||||||||||||||||||||||||||||||||
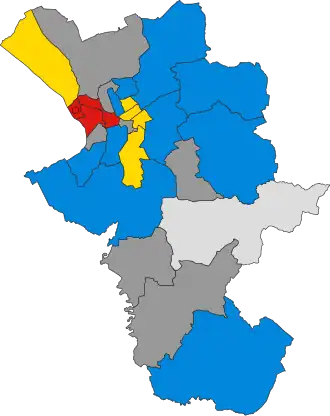 Winner of each seat at the 1987 Chester City Council election | |||||||||||||||||||||||||||||||||||||||||||||||||||||||||||||||||
| |||||||||||||||||||||||||||||||||||||||||||||||||||||||||||||||||
The 1987 Chester City Council election took place on 7 May 1987 to elect members of Chester City Council in Cheshire, England.[1] This was on the same day as other local elections.
Summary
Election result
| 1987 Chester City Council election | ||||||||||
|---|---|---|---|---|---|---|---|---|---|---|
| Party | This election | Full council | This election | |||||||
| Seats | Net | Seats % | Other | Total | Total % | Votes | Votes % | +/− | ||
| Conservative | 10 | 47.6 | 20 | 30 | 50.0 | 15,287 | 37.3 | +2.8 | ||
| Labour | 5 | 23.8 | 13 | 18 | 30.0 | 12,728 | 31.1 | –6.4 | ||
| Alliance | 5 | 23.8 | 6 | 11 | 18.3 | 11,958 | 29.2 | +1.7 | ||
| Independent | 1 | 4.8 | 0 | 1 | 1.7 | 903 | 2.2 | +2.1 | ||
| Residents | 0 | 0.0 | 0 | 0 | 0.0 | 113 | 0.3 | ±0.0 | ||
Ward results
Barrow
| Party | Candidate | Votes | % | ±% | |
|---|---|---|---|---|---|
| Conservative | W. Mapes* | 952 | 58.4 | +4.2 | |
| Alliance | R. Hesketh | 483 | 29.6 | –2.2 | |
| Labour | R. Barlow | 196 | 12.0 | –2.0 | |
| Majority | 469 | 28.8 | +6.4 | ||
| Turnout | 1,631 | 50.7 | +5.7 | ||
| Registered electors | 3,234 | ||||
| Conservative hold | Swing | ||||
Blacon Hall
| Party | Candidate | Votes | % | ±% | |
|---|---|---|---|---|---|
| Labour | L. Price* | 1,130 | 68.2 | –17.4 | |
| Conservative | F. Cresswell | 312 | 18.8 | +4.4 | |
| Alliance | W. Pashley | 215 | 13.0 | N/A | |
| Majority | 818 | 49.4 | N/A | ||
| Turnout | 1,657 | 37.7 | +12.5 | ||
| Registered electors | 4,417 | ||||
| Labour hold | Swing | ||||
Boughton Heath
| Party | Candidate | Votes | % | ±% | |
|---|---|---|---|---|---|
| Alliance | A. Farrell* | 1,086 | 43.3 | +9.6 | |
| Conservative | G. Reece | 940 | 37.5 | +0.9 | |
| Labour | D. Halley | 480 | 19.2 | –8.1 | |
| Majority | 146 | 5.8 | N/A | ||
| Turnout | 2,506 | 62.0 | +6.7 | ||
| Registered electors | 4,098 | ||||
| Alliance hold | Swing | ||||
Christieton
| Party | Candidate | Votes | % | ±% | |
|---|---|---|---|---|---|
| Conservative | C. Storrar | 1,261 | 59.3 | –6.5 | |
| Alliance | W. Carlen | 508 | 23.9 | +6.9 | |
| Labour | S. Murphy | 359 | 16.9 | –0.4 | |
| Majority | 753 | 35.4 | –13.1 | ||
| Turnout | 2,128 | 57.1 | +15.0 | ||
| Registered electors | 3,738 | ||||
| Conservative hold | Swing | ||||
College
| Party | Candidate | Votes | % | ±% | |
|---|---|---|---|---|---|
| Labour | G. Cooper | 1,124 | 51.8 | –5.7 | |
| Conservative | A. Hodgson | 632 | 29.1 | +5.1 | |
| Alliance | J. Handley | 301 | 13.9 | +0.7 | |
| Residents | D. Taylor | 113 | 5.2 | –0.2 | |
| Majority | 492 | 22.7 | –10.8 | ||
| Turnout | 2,170 | 48.4 | +3.2 | ||
| Registered electors | 4,498 | ||||
| Labour hold | Swing | ||||
Dee Point
| Party | Candidate | Votes | % | ±% | |
|---|---|---|---|---|---|
| Labour | S. Atkinson | 1,229 | 64.8 | –2.3 | |
| Labour | D. Southall* | 1,146 | 60.4 | –6.7 | |
| Conservative | P. Harris | 387 | 20.4 | –1.1 | |
| Alliance | D. Hooper | 337 | 17.8 | +6.4 | |
| Alliance | J. Indemaur | 245 | 12.9 | +1.5 | |
| Turnout | 1,898 | 40.9 | +6.1 | ||
| Registered electors | 4,640 | ||||
| Labour hold | |||||
| Labour hold | |||||
Dodleston
| Party | Candidate | Votes | % | ±% | |
|---|---|---|---|---|---|
| Conservative | W. Fair* | 607 | 60.1 | –18.4 | |
| Alliance | H. Fearnall | 343 | 34.0 | +22.0 | |
| Labour | K. Stephenson | 60 | 5.9 | –3.6 | |
| Majority | 264 | 26.1 | –40.4 | ||
| Turnout | 1,010 | 62.0 | +4.9 | ||
| Registered electors | 1,631 | ||||
| Conservative hold | Swing | ||||
Elton
| Party | Candidate | Votes | % | ±% | |
|---|---|---|---|---|---|
| Conservative | K. Peate* | 1,139 | 59.1 | +2.2 | |
| Labour | B. Cowper | 427 | 22.2 | –2.6 | |
| Alliance | L. Mitchell | 360 | 18.7 | +0.3 | |
| Majority | 712 | 36.9 | +4.8 | ||
| Turnout | 1,926 | 45.0 | +9.9 | ||
| Registered electors | 4,304 | ||||
| Conservative hold | Swing | ||||
Grosvenor
| Party | Candidate | Votes | % | ±% | |
|---|---|---|---|---|---|
| Conservative | M. Byatt* | 1,150 | 46.3 | +6.5 | |
| Labour | D. Dowswell | 825 | 33.2 | +0.9 | |
| Alliance | T. Veitch | 507 | 20.4 | –7.5 | |
| Majority | 325 | 13.1 | +5.6 | ||
| Turnout | 2,482 | 55.6 | +3.6 | ||
| Registered electors | 4,492 | ||||
| Conservative hold | Swing | ||||
Hoole
| Party | Candidate | Votes | % | ±% | |
|---|---|---|---|---|---|
| Alliance | J. Smith* | 1,059 | 45.6 | –0.1 | |
| Labour | W. Crampton | 860 | 37.1 | –4.7 | |
| Conservative | V. Holding | 401 | 17.3 | +4.7 | |
| Majority | 199 | 8.5 | +4.6 | ||
| Turnout | 2,320 | 53.1 | +4.5 | ||
| Registered electors | 4,372 | ||||
| Alliance hold | Swing | ||||
Malpas
| Party | Candidate | Votes | % | ±% | |
|---|---|---|---|---|---|
| Conservative | E. Bamforth | 760 | 52.7 | –8.1 | |
| Alliance | C. Higgle | 601 | 41.6 | +20.5 | |
| Labour | D. Owen | 82 | 5.7 | –12.4 | |
| Majority | 159 | 11.1 | –28.5 | ||
| Turnout | 1,443 | 51.6 | –0.1 | ||
| Registered electors | 2,828 | ||||
| Conservative hold | Swing | ||||
Newton
| Party | Candidate | Votes | % | ±% | |
|---|---|---|---|---|---|
| Conservative | J. Hibbert* | 988 | 43.3 | –8.2 | |
| Alliance | M. Garrod | 915 | 40.1 | +12.2 | |
| Labour | G. Cross | 381 | 16.7 | –3.9 | |
| Majority | 73 | 3.2 | –20.4 | ||
| Turnout | 2,284 | 55.1 | +11.9 | ||
| Registered electors | 4,156 | ||||
| Conservative hold | Swing | ||||
Plas Newton
| Party | Candidate | Votes | % | ±% | |
|---|---|---|---|---|---|
| Alliance | R. Hale | 949 | 39.0 | +3.6 | |
| Labour | J. Arrowsmith* | 884 | 36.3 | +0.3 | |
| Conservative | G. Llewellyn-Jones | 602 | 24.7 | –3.9 | |
| Majority | 65 | 2.7 | N/A | ||
| Turnout | 2,435 | 63.6 | +13.5 | ||
| Registered electors | 3,831 | ||||
| Alliance gain from Labour | Swing | ||||
Saughall
| Party | Candidate | Votes | % | ±% | |
|---|---|---|---|---|---|
| Alliance | D. Whitton* | 621 | 44.9 | –24.1 | |
| Conservative | A. Coughlan | 585 | 42.3 | +18.8 | |
| Labour | J. Scanlan | 176 | 12.7 | +5.2 | |
| Majority | 36 | 2.6 | –42.8 | ||
| Turnout | 1,382 | 46.9 | +1.1 | ||
| Registered electors | 2,962 | ||||
| Alliance hold | Swing | ||||
Sealand
| Party | Candidate | Votes | % | ±% | |
|---|---|---|---|---|---|
| Labour | D. Neild* | 1,150 | 61.9 | –0.4 | |
| Conservative | E. Astill | 489 | 26.3 | +3.7 | |
| Alliance | H. Carlen | 218 | 11.7 | –3.4 | |
| Majority | 661 | 35.6 | –4.2 | ||
| Turnout | 1,857 | 49.9 | +6.9 | ||
| Registered electors | 3,732 | ||||
| Labour hold | Swing | ||||
Tarvin
| Party | Candidate | Votes | % | ±% | |
|---|---|---|---|---|---|
| Conservative | C. Plenderleath | 892 | 55.3 | +7.9 | |
| Alliance | J. Trowell | 537 | 33.3 | –4.5 | |
| Labour | A. Pegrum | 184 | 11.4 | –3.3 | |
| Majority | 355 | 22.0 | +12.4 | ||
| Turnout | 1,613 | 51.1 | +10.4 | ||
| Registered electors | 3,166 | ||||
| Conservative hold | Swing | ||||
Tattenhall
| Party | Candidate | Votes | % | ±% | |
|---|---|---|---|---|---|
| Independent | J. Haynes* | 903 | 83.8 | N/A | |
| Alliance | N. Bates | 174 | 16.2 | N/A | |
| Majority | 729 | 67.6 | N/A | ||
| Turnout | 1,077 | 43.1 | +16.0 | ||
| Registered electors | 2,511 | ||||
| Independent hold | |||||
Upton Heath
| Party | Candidate | Votes | % | ±% | |
|---|---|---|---|---|---|
| Conservative | C. Houlbrook* | 1,087 | 41.3 | +4.1 | |
| Labour | S. Grant | 897 | 34.1 | –2.0 | |
| Alliance | C. Bain | 647 | 24.6 | –2.1 | |
| Majority | 190 | 7.2 | +6.2 | ||
| Turnout | 2,631 | 61.9 | +9.9 | ||
| Registered electors | 4,255 | ||||
| Conservative hold | Swing | ||||
Vicars Cross
| Party | Candidate | Votes | % | ±% | |
|---|---|---|---|---|---|
| Alliance | S. Proctor* | 1,341 | 55.2 | –7.0 | |
| Conservative | B. Anderson | 727 | 29.9 | +9.1 | |
| Labour | S. Jenkins | 362 | 14.9 | –2.1 | |
| Majority | 614 | 25.3 | –16.1 | ||
| Turnout | 2,430 | 56.5 | +6.1 | ||
| Registered electors | 4,305 | ||||
| Alliance hold | Swing | ||||
Westminster
| Party | Candidate | Votes | % | ±% | |
|---|---|---|---|---|---|
| Conservative | P. White* | 1,376 | 51.7 | +0.3 | |
| Labour | S. Hesketh | 776 | 29.1 | +3.4 | |
| Alliance | D. Simpson | 511 | 19.2 | –3.7 | |
| Majority | 600 | 22.6 | –3.1 | ||
| Turnout | 2,663 | 55.7 | +11.9 | ||
| Registered electors | 4,796 | ||||
| Conservative hold | Swing | ||||
References
- ^ "Chester City Council Election Results 1973-2007" (PDF). Colin Rallings & Michael Thrasher. The Elections Centre, Plymouth University. Retrieved 23 March 2024.
| Cheshire East Council | |
|---|---|
| Cheshire West and Chester Council | |
| Halton Borough Council | |
| Warrington Borough Council | |
| Cheshire County Council |
|
| Chester City Council | |
| Congleton Borough Council |
|
| Crewe and Nantwich Borough Council |
|
| Ellesmere Port and Neston Borough Council | |
| Macclesfield Borough Council | |
| Vale Royal Borough Council |
|
See also: Wards, Boundary changes | |
| Metropolitan boroughs |
|
|---|---|
| District councils (England) |
|
| District councils (Wales) |
|
| |