1988 Chester City Council election
| |||||||||||||||||||||||||||||||||||||||||||||||||||||||||||||||||
21 out of 60 seats to Chester City Council 31 seats needed for a majority | |||||||||||||||||||||||||||||||||||||||||||||||||||||||||||||||||
|---|---|---|---|---|---|---|---|---|---|---|---|---|---|---|---|---|---|---|---|---|---|---|---|---|---|---|---|---|---|---|---|---|---|---|---|---|---|---|---|---|---|---|---|---|---|---|---|---|---|---|---|---|---|---|---|---|---|---|---|---|---|---|---|---|---|
| |||||||||||||||||||||||||||||||||||||||||||||||||||||||||||||||||
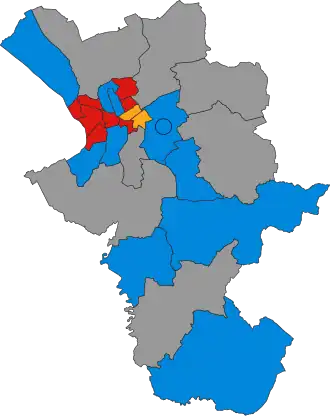 Winner of each seat at the 1988 Chester City Council election | |||||||||||||||||||||||||||||||||||||||||||||||||||||||||||||||||
| |||||||||||||||||||||||||||||||||||||||||||||||||||||||||||||||||
The 1988 Chester City Council election took place on 5 May 1988 to elect members of Chester City Council in Cheshire, England.[1] This was on the same day as other local elections.
Summary
Election result
| 1988 Chester City Council election | ||||||||||
|---|---|---|---|---|---|---|---|---|---|---|
| Party | This election | Full council | This election | |||||||
| Seats | Net | Seats % | Other | Total | Total % | Votes | Votes % | +/− | ||
| Conservative | 11 | 52.4 | 19 | 30 | 50.0 | 15,051 | 41.8 | +4.5 | ||
| Labour | 8 | 38.1 | 11 | 19 | 31.7 | 15,033 | 41.8 | +10.7 | ||
| SLD | 2 | 9.5 | 8 | 10 | 16.7 | 4,922 | 13.7 | –15.5 | ||
| Independent | 0 | 0.0 | 1 | 1 | 1.7 | 609 | 1.7 | –0.5 | ||
| SDP | 0 | 0.0 | 0 | 0 | 0.0 | 248 | 0.7 | N/A | ||
| Ratepayer | 0 | 0.0 | 0 | 0 | 0.0 | 123 | 0.3 | N/A | ||
Ward results
Blacon Hall
| Party | Candidate | Votes | % | ±% | |
|---|---|---|---|---|---|
| Labour | J. Randall | 1,292 | 84.3 | +16.1 | |
| Conservative | L. Needham | 241 | 15.7 | –3.1 | |
| Majority | 1,051 | 68.6 | +19.2 | ||
| Turnout | 1,533 | 34.8 | –2.9 | ||
| Registered electors | 4,400 | ||||
| Labour hold | Swing | ||||
Boughton
| Party | Candidate | Votes | % | ±% | |
|---|---|---|---|---|---|
| Labour | D. Robinson* | 1,042 | 72.0 | +18.3 | |
| Conservative | L. Aitchison | 406 | 28.0 | –2.1 | |
| Majority | 636 | 44.0 | N/A | ||
| Turnout | 1,448 | 57.2 | –3.6 | ||
| Registered electors | 2,531 | ||||
| Labour hold | Swing | ||||
Christleton
| Party | Candidate | Votes | % | ±% | |
|---|---|---|---|---|---|
| Conservative | B. Bailey* | 1,157 | 71.3 | +5.8 | |
| Conservative | S. Begbie | 1,154 | 71.1 | +5.3 | |
| Labour | S. Murphy | 481 | 29.6 | +12.3 | |
| Labour | J. Baker | 452 | 27.8 | +10.5 | |
| Turnout | 1,623 | 43.0 | +0.9 | ||
| Registered electors | 3,774 | ||||
| Conservative hold | |||||
| Conservative hold | |||||
College
| Party | Candidate | Votes | % | ±% | |
|---|---|---|---|---|---|
| Labour | C. Russell* | 1,390 | 65.9 | +14.1 | |
| Conservative | R. Sadler | 595 | 28.2 | –0.9 | |
| Ratepayer | D. Taylor | 123 | 5.8 | +0.6 | |
| Majority | 795 | 37.7 | +15.0 | ||
| Turnout | 2,108 | 46.3 | –2.1 | ||
| Registered electors | 4,555 | ||||
| Labour hold | Swing | ||||
Curzon
| Party | Candidate | Votes | % | ±% | |
|---|---|---|---|---|---|
| Labour | B. Jones | 1,079 | 52.7 | +10.0 | |
| Conservative | L. Parkes | 969 | 47.3 | +12.2 | |
| Majority | 110 | 5.4 | –2.2 | ||
| Turnout | 2,048 | 66.0 | +9.9 | ||
| Registered electors | 3,101 | ||||
| Labour gain from Conservative | Swing | ||||
Dee Point
| Party | Candidate | Votes | % | ±% | |
|---|---|---|---|---|---|
| Labour | J. Fetherston | 1,312 | 78.7 | +15.8 | |
| Conservative | P. Harris | 355 | 21.3 | +1.5 | |
| Majority | 957 | 57.4 | N/A | ||
| Turnout | 1,667 | 39.7 | –1.2 | ||
| Registered electors | 4,568 | ||||
| Labour hold | Swing | ||||
Farndon
| Party | Candidate | Votes | % | ±% | |
|---|---|---|---|---|---|
| Conservative | S. Rowlandson | 494 | 73.6 | –8.3 | |
| Labour | J. Brailsford | 177 | 26.4 | +8.3 | |
| Majority | 317 | 47.2 | –16.7 | ||
| Turnout | 671 | 39.7 | +0.2 | ||
| Registered electors | 1,692 | ||||
| Conservative hold | Swing | ||||
Grosvenor
| Party | Candidate | Votes | % | ±% | |
|---|---|---|---|---|---|
| Conservative | D. Pritchard | 1,215 | 53.2 | +6.9 | |
| Labour | D. Dowswell | 1,068 | 46.8 | +13.6 | |
| Majority | 147 | 6.4 | –6.7 | ||
| Turnout | 2,283 | 51.3 | –5.3 | ||
| Registered electors | 4,450 | ||||
| Conservative hold | Swing | ||||
Hoole
| Party | Candidate | Votes | % | ±% | |
|---|---|---|---|---|---|
| SLD | R. Stunell* | 1,115 | 50.6 | +5.0 | |
| Labour | S. Hesketh | 769 | 34.9 | –2.2 | |
| Conservative | V. Holding | 318 | 14.4 | –2.9 | |
| Majority | 346 | 15.7 | +7.2 | ||
| Turnout | 2,202 | 51.3 | –1.8 | ||
| Registered electors | 4,291 | ||||
| SLD hold | Swing | ||||
Malpas
| Party | Candidate | Votes | % | ±% | |
|---|---|---|---|---|---|
| Conservative | B. Hassall* | 663 | 52.1 | –0.6 | |
| Independent | C. Higgie | 609 | 47.9 | +6.3 | |
| Majority | 54 | 4.2 | –6.9 | ||
| Turnout | 1,272 | 44.5 | –7.1 | ||
| Registered electors | 2,858 | ||||
| Conservative hold | Swing | ||||
Newton
| Party | Candidate | Votes | % | ±% | |
|---|---|---|---|---|---|
| Conservative | J. Ebo* | 914 | 44.7 | +1.4 | |
| SLD | M. Garrod | 746 | 36.5 | –3.6 | |
| Labour | R. Cross | 385 | 18.8 | +2.1 | |
| Majority | 168 | 8.2 | +5.0 | ||
| Turnout | 2,045 | 49.4 | –5.7 | ||
| Registered electors | 4,142 | ||||
| Conservative hold | Swing | ||||
Plas Newton
| Party | Candidate | Votes | % | ±% | |
|---|---|---|---|---|---|
| Labour | H. Jones* | 1,052 | 44.9 | +8.6 | |
| SLD | M. Hale | 701 | 29.9 | –9.1 | |
| Conservative | W. Sutton | 589 | 25.1 | +0.4 | |
| Majority | 351 | 15.0 | N/A | ||
| Turnout | 2,342 | 61.5 | –2.1 | ||
| Registered electors | 3,806 | ||||
| Labour hold | Swing | ||||
Saughall
| Party | Candidate | Votes | % | ±% | |
|---|---|---|---|---|---|
| Conservative | A. Coughlan | 910 | 70.1 | +27.8 | |
| Labour | R. Jones | 388 | 29.9 | +17.2 | |
| Majority | 522 | 40.2 | N/A | ||
| Turnout | 1,298 | 43.7 | –3.2 | ||
| Registered electors | 2,967 | ||||
| Conservative gain from SLD | Swing | ||||
Sealand
| Party | Candidate | Votes | % | ±% | |
|---|---|---|---|---|---|
| Labour | R. Bott* | 1,189 | 74.3 | +12.4 | |
| Conservative | B. Eaves | 411 | 25.7 | –0.6 | |
| Majority | 778 | 48.6 | +13.0 | ||
| Turnout | 1,600 | 43.5 | –6.4 | ||
| Registered electors | 3,678 | ||||
| Labour hold | Swing | ||||
Tattenhall
| Party | Candidate | Votes | % | ±% | |
|---|---|---|---|---|---|
| Conservative | F. Pierce* | 611 | 71.6 | N/A | |
| Labour | J. Starkey | 242 | 28.4 | N/A | |
| Majority | 369 | 43.3 | N/A | ||
| Turnout | 853 | 33.3 | –9.8 | ||
| Registered electors | 2,561 | ||||
| Conservative hold | |||||
Upton Grange
| Party | Candidate | Votes | % | ±% | |
|---|---|---|---|---|---|
| Conservative | J. Butler* | 681 | 43.7 | +6.1 | |
| SLD | L. O'Sullivan | 641 | 41.1 | –11.2 | |
| Labour | S. Taylor | 238 | 15.3 | +5.2 | |
| Majority | 40 | 2.6 | N/A | ||
| Turnout | 1,560 | 50.7 | –1.2 | ||
| Registered electors | 3,077 | ||||
| Conservative hold | Swing | ||||
Upton Heath
| Party | Candidate | Votes | % | ±% | |
|---|---|---|---|---|---|
| Labour | R. Griffiths* | 1,209 | 48.9 | +14.8 | |
| Conservative | J. Snell | 1,003 | 40.6 | –0.7 | |
| SLD | C. Bain | 259 | 10.5 | –14.1 | |
| Majority | 206 | 8.3 | N/A | ||
| Turnout | 2,471 | 59.3 | –2.6 | ||
| Registered electors | 4,167 | ||||
| Labour hold | Swing | ||||
Vicars Cross
| Party | Candidate | Votes | % | ±% | |
|---|---|---|---|---|---|
| SLD | K. Holding* | 1,107 | 52.4 | –2.8 | |
| Conservative | P. Thompson | 680 | 32.2 | +2.3 | |
| Labour | D. Halley | 327 | 15.5 | +0.6 | |
| Majority | 427 | 20.2 | –5.0 | ||
| Turnout | 2,114 | 49.5 | –7.0 | ||
| Registered electors | 4,269 | ||||
| SLD hold | Swing | ||||
Waverton
| Party | Candidate | Votes | % | ±% | |
|---|---|---|---|---|---|
| Conservative | J. Bramall* | 366 | 44.7 | –18.1 | |
| SLD | C. Walley | 353 | 43.1 | +29.8 | |
| Labour | K. Bird | 100 | 12.2 | –11.6 | |
| Majority | 13 | 1.6 | –21.8 | ||
| Turnout | 819 | 56.2 | +5.5 | ||
| Registered electors | 1,457 | ||||
| Conservative hold | Swing | ||||
Westminster
| Party | Candidate | Votes | % | ±% | |
|---|---|---|---|---|---|
| Conservative | R. Short* | 1,319 | 54.8 | +3.1 | |
| Labour | P. Byrne | 841 | 34.9 | +5.8 | |
| SDP | S. Barlow | 248 | 10.3 | N/A | |
| Majority | 478 | 19.9 | –2.7 | ||
| Turnout | 2,408 | 50.7 | –5.0 | ||
| Registered electors | 4,748 | ||||
| Conservative hold | Swing | ||||
References
- ^ "Chester City Council Election Results 1973-2007" (PDF). Colin Rallings & Michael Thrasher. The Elections Centre, Plymouth University. Retrieved 23 March 2024.
| Cheshire East Council | |
|---|---|
| Cheshire West and Chester Council | |
| Halton Borough Council | |
| Warrington Borough Council | |
| Cheshire County Council |
|
| Chester City Council | |
| Congleton Borough Council |
|
| Crewe and Nantwich Borough Council |
|
| Ellesmere Port and Neston Borough Council | |
| Macclesfield Borough Council | |
| Vale Royal Borough Council |
|
See also: Wards, Boundary changes | |
| Metropolitan boroughs |
|
|---|---|
| District councils (England) |
|
| District councils (Scotland) |
|