1988 Falkirk District Council election
| ||||||||||||||||||||||||||||||||||||||||||||||||||||||||||||||||||||
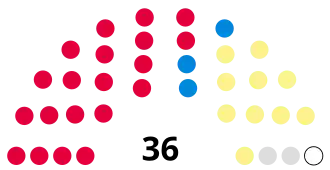
All 36 seats to Falkirk District Council 19 seats needed for a majority | ||||||||||||||||||||||||||||||||||||||||||||||||||||||||||||||||||||
|---|---|---|---|---|---|---|---|---|---|---|---|---|---|---|---|---|---|---|---|---|---|---|---|---|---|---|---|---|---|---|---|---|---|---|---|---|---|---|---|---|---|---|---|---|---|---|---|---|---|---|---|---|---|---|---|---|---|---|---|---|---|---|---|---|---|---|---|---|
| ||||||||||||||||||||||||||||||||||||||||||||||||||||||||||||||||||||
 Composition of District Council after the election | ||||||||||||||||||||||||||||||||||||||||||||||||||||||||||||||||||||
Elections to the Falkirk District Council took place on 5 May 1988, alongside elections to the councils of Scotland's various other districts.
Results
| Party | Seats | Gains | Losses | Net gain/loss | Seats % | Votes % | Votes | +/− | |
|---|---|---|---|---|---|---|---|---|---|
| Labour | 20 | 1 | 6 | 55.6 | 48.8 | 25,747 | |||
| SNP | 10 | 3 | 0 | 27.8 | 35.2 | 18,570 | |||
| Conservative | 3 | 1 | 0 | 8.3 | 8.2 | 4,302 | |||
| Independent | 2 | 1 | 1 | 5.6 | 4.4 | 2,301 | |||
| Independent Labour | 1 | 1 | 0 | 2.8 | 1.4 | 725 | |||
| Denny, Dunnipace Non-Party Group | 0 | 0 | 0 | 0.0 | 2.1 | 1,108 | New | ||
Source:[1]
References
- ^ "Scottish District Elections 1988" (PDF). Elections Centre. Retrieved 8 March 2020.