1993 Northumberland County Council election
| |||||||||||||||||||||||||||||||||||||||||||||||||||||
All 66 seats to Northumberland County Council 34 seats needed for a majority | |||||||||||||||||||||||||||||||||||||||||||||||||||||
|---|---|---|---|---|---|---|---|---|---|---|---|---|---|---|---|---|---|---|---|---|---|---|---|---|---|---|---|---|---|---|---|---|---|---|---|---|---|---|---|---|---|---|---|---|---|---|---|---|---|---|---|---|---|
| Turnout | 32.5% | ||||||||||||||||||||||||||||||||||||||||||||||||||||
| |||||||||||||||||||||||||||||||||||||||||||||||||||||
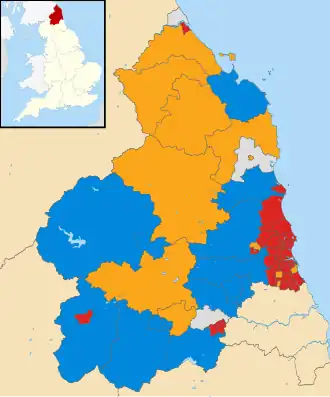 Map of the results of the 1993 local election. | |||||||||||||||||||||||||||||||||||||||||||||||||||||
| |||||||||||||||||||||||||||||||||||||||||||||||||||||
Local elections to Northumberland County Council, a county council in the north east of England, were held on 6 May 1993, resulting in a council with Labour members forming a majority.
Results
| Party | Seats | Gains | Losses | Net gain/loss | Seats % | Votes % | Votes | +/− | |
|---|---|---|---|---|---|---|---|---|---|
| Labour | 39 | 59.1 | 37.4 | 29,032 | |||||
| Conservative | 13 | 19.7 | 27.8 | 21,603 | |||||
| Liberal Democrats | 11 | 16.7 | 28.8 | 22,377 | |||||
| Independent | 5 | 4.5 | 5.0 | 3,863 | |||||
| Green | 0 | 0.0 | 0.9 | 699 | |||||
References
- ^ "Local Election Summaries 1993". The Elections Centre. Retrieved 21 June 2019.
- ^ p.15
External links
| Northumberland County Council | |
|---|---|
| Alnwick District Council | |
| Berwick-upon-Tweed Borough Council |
|
| Blyth Valley Borough Council |
|
| Castle Morpeth Borough Council |
|
| Tynedale District Council | |
| Wansbeck District Council |
|
| |
| County councils (England) |
|
|---|---|
| County councils (Wales) |
|
| District councils (Northern Ireland) | |
| Sui generis |
|