2005 Northumberland County Council election
| |||||||||||||||||||||||||||||||||||||||||||||||||||||
All 67 seats to Northumberland County Council 34 seats needed for a majority | |||||||||||||||||||||||||||||||||||||||||||||||||||||
|---|---|---|---|---|---|---|---|---|---|---|---|---|---|---|---|---|---|---|---|---|---|---|---|---|---|---|---|---|---|---|---|---|---|---|---|---|---|---|---|---|---|---|---|---|---|---|---|---|---|---|---|---|---|
| Turnout | 61.0% | ||||||||||||||||||||||||||||||||||||||||||||||||||||
| |||||||||||||||||||||||||||||||||||||||||||||||||||||
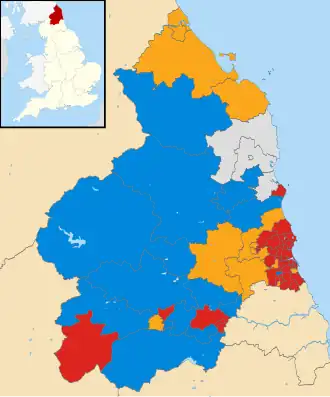 Map of the results of the 2005 local election. | |||||||||||||||||||||||||||||||||||||||||||||||||||||
| |||||||||||||||||||||||||||||||||||||||||||||||||||||
Local elections to Northumberland County Council, a county council in the north east of England, were held on 5 May 2005, resulting in a council with Labour members forming a majority.
Results
| Party | Seats | Gains | Losses | Net gain/loss | Seats % | Votes % | Votes | +/− | |
|---|---|---|---|---|---|---|---|---|---|
| Labour | 35 | 34.4 | 51,324 | ||||||
| Liberal Democrats | 14 | 36.1 | 53,509 | ||||||
| Conservative | 14 | 24.3 | 36,081 | ||||||
| Independent | 4 | 5.1 | 7,607 | ||||||
| Green | 0 | 0.4 | 522 | ||||||
References
- ^ "Local Election Summaries 2005". The Elections Centre. Retrieved 21 June 2019.
- ^ Andrew Teale. "Local Election Results 2005 - Northumberland". Local Elections Archive Project.
External links
| Northumberland County Council | |
|---|---|
| Alnwick District Council | |
| Berwick-upon-Tweed Borough Council |
|
| Blyth Valley Borough Council |
|
| Castle Morpeth Borough Council |
|
| Tynedale District Council | |
| Wansbeck District Council |
|
| |
| County council elections |
|
|---|---|
| Unitary authorities |
|
| District councils (Northern Ireland) | |
| Sui generis |
|
| Mayoral elections |
|
| |