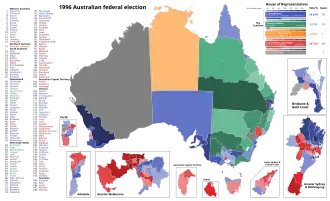
The following tables show results for the Australian House of Representatives at the 1996 federal election held on 2 March 1996.[ 1]
Australia
House of Reps (IRV ) – 1996–1998 – Turnout 94.99% (CV ) — Informal 3.78%
Party
Votes
%
Swing
Seats
Change
Liberal
4,210,689
38.69
+1.92
75
National
893,170
8.21
+1.04
18
Country Liberal
38,302
0.35
+0.02
1
Liberal/National Coalition
5,142,161
47.25
+2.98
94
Labor
4,217,765
38.75
−6.17
49
Democrats
735,848
6.76
+3.01
Greens [ a] 317,654
2.92
+1.09
Independents
262,420
2.41
−0.73
5
AAFI
73,023
0.67
+0.64
Call to Australia
43,183
0.40
−0.08
Natural Law
41,573
0.38
−0.36
No Aircraft Noise
18,626
0.17
+0.17
Indigenous Peoples
12,507
0.11
+0.08
Reclaim Australia
6,457
0.06
+0.06
Women's Party
6,173
0.06
+0.06
One Australia
3,159
0.03
+0.03
Grey Power
2,815
0.03
+0.01
Pensioner & CIR Alliance
332
0.00
+0.00
Republican
156
0.00
+0.00
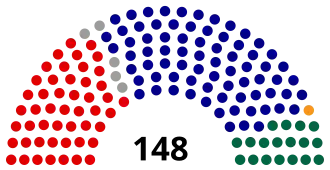
Total
10,883,852
148
Two-party-preferred vote
Liberal–National coalition Win
53.63
+5.07
94
Labor
46.37
−5.07
49
States
New South Wales
1996 Australian federal election
Turnout 96.4% (CV ) — Informal 3.6% [ 2]
Party
Votes
%
Swing
Seats
Change
Liberal
1,229,423
33.46
+1.69
19
National
443,542
12.07
+2.32
10
Liberal/National Coalition
1,672,965
45.53
+4.01
29
Labor
1,453,542
39.56
-8.76
20
Democrats
240,255
6.54
+3.73
Greens
92,549
2.52
+1.44
Independents
88,509
2.41
1
AAFI
52,128
1.42
+1.37
Christian Democrats
34,108
0.93
+0.31
No Aircraft Noise
18,626
0.51
Natural Law
11,252
0.31
–0.35
Reclaim Australia
5,487
0.15
Women's Party
1,708
0.05
Total
3,674,209
50
Two-party-preferred vote
Liberal/National Coalition
1,922,165
52.56
+6.95
29
Labor
1,734,777
47.44
-6.95
20
Invalid/blank votes
138,157
3.62
Turnout
3,812,366
96.37
Registered voters
3,955,782
Source: Federal Elections 1996
Divisions in: New South Wales
Victoria
Queensland
Western Australia
South Australia
Tasmania
Australian Capital and Northern Territories
Victoria
1996 Australian federal election
Turnout 96.1% (CV ) — Informal 2.9% [ 2]
Party
Votes
%
Swing
Seats
Change
Liberal
1,106,556
39.90
−0.31
19
National
128,091
4.62
−0.39
2
Liberal/National Coalition
1,234,647
44.52
−0.70
21
Labor
1,190,404
42.92
−3.53
16
Democrats
203,902
7.35
3.66
Greens
52,812
1.90
1.78
Independent
45,243
1.63
−1.13
Natural Law
20,988
0.76
−0.39
AAFI
16,914
0.61
0.54
Call to Australia
8,081
0.29
−0.19
Pensioner and CIR
332
0.00
0.01
Total
2,773,323
37
Two-party-preferred vote
Labor
1,388,142
50.30
-1.50
16
Liberal/National Coalition
1,371,480
49.70
1.50
21
Invalid/blank votes
83,615
2.93
Turnout
2,856,936
96.11
Registered voters
2,972,635
Source: Federal Elections 1996
Divisions in: New South Wales
Victoria
Queensland
Western Australia
South Australia
Tasmania
Australian Capital and Northern Territories
Queensland
1996 Australian federal election
Turnout 96.6% (CV ) — Informal 2.5% [ 2]
Party
Votes
%
Swing
Seats
Change
Liberal
764,140
38.78
7.52
17
National
306,986
15.58
0.85
6
Liberal/National Coalition
1,071,126
54.36
8.37
23
Labor
664,371
33.72
-6.77
2
Democrats
131,944
6.70
2.64
Independents [ b] 25,629
1.30
-1.57
1
Greens
49,462
2.51
-0.69
Indigenous Peoples
12,507
0.63
-2.19
Women's Party
4,465
0.23
0.01
Confederate Action
4,279
0.22
0.03
One Australia
3,159
0.16
Natural Law
1,532
0.08
AAFI
1,258
0.06
Call to Australia
494
0.03
Republican
156
0.01
Total
1,970,382
26
Two-party-preferred vote
Liberal/National Coalition
1,158,122
60.22
+8.65
23
Labor
765,019
39.78
-8.65
2
Invalid/blank votes
50,605
2.50
-0.12
Turnout
2,020,987
96.63
Registered voters
2,091,384
Source: Federal Elections 1996
Divisions in: New South Wales
Victoria
Queensland
Western Australia
South Australia
Tasmania
Australian Capital and Northern Territories
Western Australia
1996 Australian federal election
Turnout 96.6% (CV ) — Informal 2.5% [ 2]
Party
Votes
%
Swing
Seats
Change
Liberal
440,647
44.02
-4.99
8
National
13,333
1.33
1.09
Liberal/National Coalition
453,980
45.35
-3.90
8
Labor
347,583
34.73
-4.62
3
Independent
87,328
8.72
7.46
3
Democrats
55,862
5.58
2.30
Greens
53,101
5.31
-0.46
Natural Law
2,159
0.22
-0.31
AAFI
943
0.09
Total
1,000,956
14
Two-party-preferred vote
Liberal/National Coalition
557,055
56.00
2.02
8
Labor
437,694
44.00
-2.02
3
Invalid/blank votes
32,616
3.16
0.66
Turnout
1,033,572
94.95
Registered voters
1,088,487
Source: Federal Elections 1996
Divisions in: New South Wales
Victoria
Queensland
Western Australia
South Australia
Tasmania
Australian Capital and Northern Territories
South Australia
1996 Australian federal election
Turnout 95.9% (CV ) — Informal 4.1% [ 2]
Party
Votes
%
Swing
Seats
Change
Liberal
460,246
49.99
+4.33
10
Labor
320,678
34.83
-4.01
2
Democrats
93,899
10.20
+2.41
Greens
27,146
2.95
+2.79
Independent
9,660
1.05
-3.64
Natural Law
4,495
0.49
-0.98
Grey Power
2,815
0.31
+0.12
AAFI
1,780
0.19
Total
959,891
12
Two-party-preferred vote
Liberal/National Coalition
524,445
57.26
4.59
10
Labor
391,516
42.74
-4.59
2
Invalid/blank votes
39,162
4.08
0.02
Turnout
959,881
95.89
Registered voters
1,001,006
Source: Federal Elections 1996
Divisions in: New South Wales
Victoria
Queensland
Western Australia
South Australia
Tasmania
Australian Capital and Northern Territories
Tasmania
1996 Australian federal election
Turnout 96.6% (CV ) — Informal 2.3% [ 2]
Party
Votes
%
Swing
Seats
Change
Liberal
138,087
44.46
+2.42
2
National
1,218
0.39
+0.39
Liberal/National Coalition
139,305
44.85
+2.81
2
Labor
137,607
44.31
−2.45
3
Greens
19,689
6.34
−1.58
Democrats
12,696
4.09
+1.60
Independent
1,274
0.41
−0.09
Total
310,571
5
Two-party-preferred vote
Labor
159,853
51.58
−3.07
3
Liberal/National Coalition
150,057
48.42
+3.07
2
Invalid/blank votes
7,472
2.35
−0.38
Turnout
318,043
96.58
Registered voters
329,304
Source: Federal Elections 1996
Divisions in: New South Wales
Victoria
Queensland
Western Australia
South Australia
Tasmania
Australian Capital and Northern Territories
|abc
Territories
Australian Capital Territory
1996 Australian federal election
First party
Second party
Leader
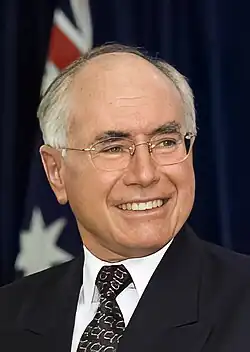
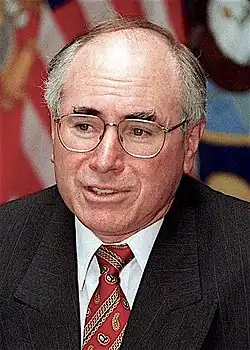
Paul Keating
John Howard
Party
Labor
Coalition
Last election
2 seats
0 seats
Seats won
3 seats
0 seats
Seat change
Popular vote
91,447
78,109
Percentage
47.91%
40.92%
Swing
TPP
55.5%
45.5%
TPP swing
Turnout 96.7% (CV ) — Informal 2.8% [ 2]
Party
Votes
%
Swing
Seats
Change
Labor
91,447
47.91
–5.43
3
Liberal
78,109
40.92
+6.73
Greens
16,596
8.70
+6.97
Natural Law
778
0.41
–0.39
Independents
3,933
2.06
–1.21
Total
190,863
3
Two-party-preferred vote
Labor
105,323
55.5
–5.7
3
Liberal
84,592
45.5
+5.7
0
Invalid/blank votes
5,543
2.82
–0.53
Turnout
196,406
96.67
Registered voters
203,170
Source: Federal Elections 1996
Northern Territory
1996 Australian federal election
Divisions in: New South Wales
Victoria
Queensland
Western Australia
South Australia
Tasmania
Australian Capital and Northern Territories
See also
Notes
^ The Australian Greens were founded in 1992, but not all local organisations immediately affiliated. The Greens total includes Australian Greens, Greens Western Australia , Victorian Greens , Tasmanian Greens , Central Coast Green Party, and Richmond/Clarence Greens.
^ Pauline Hanson has been counted as being elected an independent. She had been disendorsed as the Liberal candidate and ran as an independent, but she remained a Liberal on the ballot paper.
References