1998 Australian federal election Registered 12,154,050 Turnout 11,545,201 (94.99%)pp )
The following tables show results for the Australian House of Representatives at the 1998 federal election held on 3 October 1998.[ 1] [ 2]
Australia
House of Reps (IRV ) – 1998–2001 – Turnout 94.99% (CV ) — Informal 3.78%[ 2]
Party
Votes
%
Swing
Seats
Change
Labor
4,454,306
40.10
+1.34
67
Liberal
3,764,707
33.89
−4.80
64
National
588,088
5.29
−2.91
16
Country Liberal
36,014
0.32
−0.03
0
Liberal/National Coalition
4,388,809
39.51
-7.74
80
One Nation
936,621
8.43
*
Democrats
569,875
5.13
−1.63
Greens [ b] 290,709
2.62
−0.30
Independents [ c] 195,180
1.76
−0.51
1
Unity
87,252
0.79
*
Christian Democrats [ d] 64,916
0.58
+0.18
Australia First
28,069
0.25
*
Natural Law
18,425
0.17
-0.21
Australian Shooters Party
12,675
0.11
*
Democratic Socialist Electoral League
9,749
0.09
*
Citizens Electoral Council
8,293
0.07
*
Progressive Labour
6,122
0.06
*
No Aircraft Noise
5,298
0.05
−0.12
Tasmania First
4,551
0.04
*
Australian Reform Party
4,220
0.04
*
Abolish Child Support/Family Court Party
2,312
0.02
*
Women's Party
1,426
0.01
−0.05
Family Law Reform
1,199
0.01
*
Communist Party of Australia (current)
801
0.00
+0.00
Socialist Equality
531
0.00
*
Independent EFF
513
0.00
*
Republican
403
0.00
+0.00
Not Affiliated
14,793
0.13
+0.01
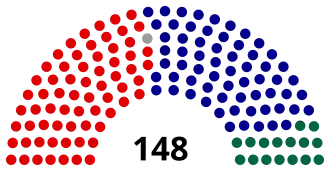
Total
11,109,063
148
Two-party-preferred vote
Liberal/National coalition
5,413,431
49.02
−4.61
80
Labor
5,630,409
50.98
+4.61
67
Invalid/blank votes
436,138
3.78
Turnout
11,545,201
95.0
Registered voters
12,154,050
Source: Federal Elections 1998
States
New South Wales
1998 Australian federal election
Turnout 96.4% (CV ) — Informal 3.6% [ 2]
Party
Votes
%
Swing
Seats
Change
Liberal
1,131,545
30.49
−2.97
18
National
293,126
7.90
−4.17
9
Liberal/National Coalition
1,424,671
38.39
−7.14
27
Labor
1,489,021
40.12
+0.56
22
One Nation
332,510
8.96
+8.96
Democrats
154,496
4.16
−2.38
Greens
98,647
2.66
+0.14
Independents
96,719
2.61
+0.20
1
Unity
57,666
1.55
+1.55
Christian Democrats
38,023
1.02
+0.10
No Aircraft Noise
5,298
0.14
Democratic Socialist
3,296
0.09
1.37
Natural Law
3,065
0.08
0.31
Citizens Electoral Council
2,332
0.06
Progressive Labour
1,131
0.03
Australia First
1,024
0.03
Abolish Child Support
544
0.01
Socialist Equality
531
0.01
No GST
240
0.01
Republican
227
0.01
Total
3,711,144
50
Two-party-preferred vote
Liberal/National Coalition
1,766,640
48.46
−4.11
27
Labor
1,879,281
51.54
+4.11
22
Invalid/blank votes
217,024
5.4
Turnout
3,866,083
94.8
Registered voters
4,076,081
Source: Federal Elections 1998
Divisions in: New South Wales
Victoria
Queensland
Western Australia
South Australia
Tasmania
Australian Capital and Northern Territories
Victoria
1998 Australian federal election
Results by division for the House of Representatives, shaded by winning party's margin of victory.
Turnout 95.6% (CV ) — Informal 3.5% [ 2]
Party
Votes
%
Swing
Seats
Change
Liberal
1,053,990
37.08
-2.82
16
National
77,385
2.72
-1.90
2
Liberal/National Coalition
1,131,375
39.80
-4.72
18
Labor
1,261,289
44.37
1.45
19
Democrats
171,091
6.02
-1.33
One Nation
105,798
3.72
3.72
Greens
59,383
2.09
0.19
Independent
38,232
1.34
-0.29
Unity
29,265
1.03
1.03
Shooters
12,675
0.45
0.45
Natural Law
9,654
0.34
0.00
Australia First
6,455
0.23
0.00
Progressive Labour
4,991
0.18
0.00
Reform
4,220
0.15
0.00
Christian Democrats
3,793
0.13
0.00
Citizens Electoral Council
2,914
0.10
0.00
Abolish Child Support
945
0.03
0.00
Democratic Socialist
425
0.01
0.00
Republican
176
0.01
0.00
Total
2,842,681
37
Two-party-preferred vote
Labor
1,521,560
53.53
3.22
19
Liberal/National Coalition
1,321,121
46.47
-3.22
18
Invalid/blank votes
103,524
3.5
Turnout
2,946,205
95.6
Registered voters
3,081,632
Source: Federal Elections 1998
Divisions in: New South Wales
Victoria
Queensland
Western Australia
South Australia
Tasmania
Australian Capital and Northern Territories
Queensland
1998 Australian federal election
Turnout 94.2% (CV ) — Informal 3.2% [ 2]
Party
Votes
%
Swing
Seats
Change
Liberal
615,153
30.86
-8.44
14
National
199,185
9.99
-5.91
5
Liberal/National Coalition
814,338
40.85
-14.35
19
Labor
719,743
36.11
2.91
8
One Nation
285,983
14.35
14.35
Democrats
80,003
4.01
-2.69
Greens
47,440
2.38
-2.42
Independents [ c] 29,388
1.47
1.47
Christian Democrats
11,243
0.56
0.56
Citizens Electoral Council
1,506
0.08
0.08
Women's Party
1,426
0.07
0.00
Family Law Reform
1,199
0.06
0.00
Democratic Socialist
778
0.04
0.00
Abolish Child Support
170
0.01
0.00
Australia First
158
0.01
0.00
Total
1,993,375
27
Two-party-preferred vote
Labor
935,867
46.95
7.17
8
Liberal/National Coalition
1,057,508
53.05
-7.17
19
Invalid/blank votes
68,659
3.2
Turnout
2,062,034
94.2
Registered voters
2,188,024
Source: Federal Elections 1998
Divisions in: New South Wales
Victoria
Queensland
Western Australia
South Australia
Tasmania
Australian Capital and Northern Territories
Western Australia
1998 Australian federal election
Turnout 94.7% (CV ) — Informal 4.2% [ 2]
Party
Votes
%
Swing
Seats
Change
Liberal
397,836
38.15
-5.87
7
National
13,596
1.30
-0.03
Liberal/National Coalition
411,432
39.46
-5.90
7
Labor
377,545
36.21
1.48
7
One Nation
96,708
9.27
9.27
Greens
52,674
5.05
-0.26
Democrats
41,364
3.97
-1.61
Independents
31,980
3.07
-5.71
Australia First
18,828
1.81
1.81
Christian Democrats
8,336
0.80
0.80
Citizens Electoral Council
1,541
0.15
0.15
Natural Law
951
0.09
-0.16
Democratic Socialist
682
0.07
0.07
Abolish Child Support
413
0.04
0.04
Unity
321
0.03
0.03
Total
1,042,775
14
Two-party-preferred vote
Liberal/National Coalition
527,042
50.54
-5.46
7
Labor
515,733
49.46
+5.46
7
Invalid/blank votes
45,509
4.18
+1.02
Turnout
1,088,284
94.66
Registered voters
1,149,619
Source: Federal Elections 1998
Divisions in: New South Wales
Victoria
Queensland
Western Australia
South Australia
Tasmania
Australian Capital and Northern Territories
South Australia
1998 Australian federal election
Turnout 95.6% (CV ) — Informal 3.5% [ 2]
Party
Votes
%
Swing
Seats
Change
Liberal
389,382
42.05
-7.94
9
National
4,796
0.52
0.52
Liberal/National Coalition
394,178
42.57
-7.42
9
Labor
319,267
34.48
-0.35
3
Democrats
93,905
10.14
-0.06
One Nation
90,773
9.80
0.00
Independent
13,327
1.44
0.39
Greens
4,576
0.49
-2.46
Natural Law
3,526
0.38
-0.11
Christian Democrats
3,521
0.38
0.00
Australia First
1,604
0.17
0.00
Communist
801
0.09
0.00
Independent EFF
513
0.06
0.00
Total
925,991
12
Two-party-preferred vote
Liberal/National Coalition
491,802
53.11
-4.15
9
Labor
434,189
46.89
4.15
3
Invalid/blank votes
44,074
4.54
0.46
Turnout
970,065
96.91
Registered voters
1,001,006
Source: Federal Elections 1998
Divisions in: New South Wales
Victoria
Queensland
Western Australia
South Australia
Tasmania
Australian Capital and Northern Territories
Tasmania
1998 Australian federal election
First party
Second party
Leader
Kim Beazley
John Howard
Party
Labor
Coalition
Last election
3 seats
2 seats
Seats won
5 seats
0 seats
Seat change
Popular vote
150,384
117,377
Percentage
48.9%
38.2%
Swing
TPP
57.32%
42.68%
TPP swing
Turnout 95.6% (CV ) — Informal 3.5% [ 2]
Party
Votes
%
Swing
Seats
Change
Labor
150,384
48.91
4.60
5
Liberal
117,377
38.17
-6.29
Greens
17,091
5.56
-0.78
Democrats
10,024
3.26
-0.83
One Nation
7,553
2.46
0.00
Tasmania First
4,551
1.48
0.00
Total
307,477
5
Two-party-preferred vote
Labor
176,241
57.32
5.74
5
Liberal
131,236
42.68
-5.74
0
Invalid/blank votes
9,819
3.09
0.74
Turnout
317,296
96.12
Registered voters
330,121
Source: Federal Elections 1998
Divisions in: New South Wales
Victoria
Queensland
Western Australia
South Australia
Tasmania
Australian Capital and Northern Territories
Territories
Australian Capital Territory
1998 Australian federal election
First party
Second party
Leader
Kim Beazley
John Howard
Party
Labor
Coalition
Last election
3 seats
0 seats
Seats won
2 seats
0 seats
Seat change
Popular vote
98,588
59,424
Percentage
50.64%
30.52%
Swing
TPP
62.4%
37.6%
TPP swing
Turnout 95.7% (CV ) — Informal 2.9% [ 2]
Party
Votes
%
Swing
Seats
Change
Labor
98,588
50.64
+2.73
2
Liberal
59,424
30.52
–10.40
Democrats
14,394
7.39
One Nation
9,895
5.08
Greens
8,145
4.18
–4.52
Democratic Socialist
2,641
1.36
Natural Law
539
0.28
–0.13
Independents
1,057
0.54
–1.52
Total
194,683
2
Two-party-preferred vote
Labor
121,552
62.4
+7.0
2
Liberal
73,131
37.6
–7.0
0
Invalid/blank votes
5,743
2.87
+0.05
Turnout
200,426
95.65
Registered voters
209,536
Source: Federal Elections 1998
Northern Territory
1998 Australian federal election
First party
Second party
Leader
Kim Beazley
John Howard
Party
Labor
Coalition
Last election
0 seats
1 seat
Seats won
1
0
Seat change
Popular vote
38,469
36,014
Percentage
42.30%
39.60%
Swing
TPP
50.6%
49.4%
TPP swing
Divisions in: New South Wales
Victoria
Queensland
Western Australia
South Australia
Tasmania
Australian Capital and Northern Territories
See also
Notes
References

_(cropped).jpg)