2010 Michigan Senate election
| |||||||||||||||||||||||||||||||||||||
38 seats in the Michigan Senate 20 seats needed for a majority | |||||||||||||||||||||||||||||||||||||
|---|---|---|---|---|---|---|---|---|---|---|---|---|---|---|---|---|---|---|---|---|---|---|---|---|---|---|---|---|---|---|---|---|---|---|---|---|---|
| Turnout | 3,145,959 (42.51%) | ||||||||||||||||||||||||||||||||||||
| |||||||||||||||||||||||||||||||||||||
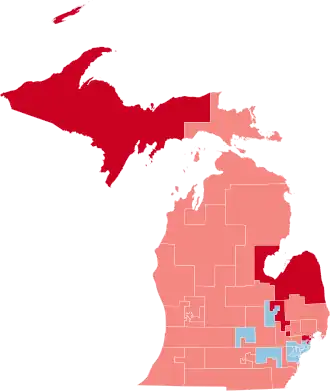 Results: Republican gain Democratic hold Republican hold | |||||||||||||||||||||||||||||||||||||
| |||||||||||||||||||||||||||||||||||||

| Elections in Michigan |
|---|
 |
The 2010 Michigan Senate elections were held on November 2 of that year, with partisan primaries to determine each party's nominees on August 3. The election was the last contested under constituency boundaries drawn as a result of the 2000 U.S. Census, and members served in the 96th and 97th Legislatures.
Term-limited Senators
State Senators are only allowed to serve two four-year terms, a maximum of eight years. The following Senators were not eligible to run for a new term in 2010:
- Sen. Jim Barcia (D-31st District)
Predictions
| Source | Ranking | As of |
|---|---|---|
| Governing[1] | Likely R | November 1, 2010 |
Results
All results below are from the certified election results posted by the secretary of state.[2]
| Party | Candidate | Votes | % | |
|---|---|---|---|---|
| Democratic | Coleman Young II | 40,122 | 93.27 | |
| Republican | Dakeisha Harwick | 2,895 | 6.7 | |
| Total votes | 43,017 | 100.0 | ||
| Democratic hold | ||||
| Party | Candidate | Votes | % | |
|---|---|---|---|---|
| Democratic | Bert Johnson | 34,858 | 65.62 | |
| Republican | John Chouinard | 17,459 | 32.86 | |
| Libertarian | Gregory Creswell | 808 | 1.52 | |
| Total votes | 53,125 | 100.0 | ||
| Democratic hold | ||||
| Party | Candidate | Votes | % | |
|---|---|---|---|---|
| Democratic | Morris Hood III | 43,849 | 78.52 | |
| Republican | Doug Mitchell | 11,994 | 21.48 | |
| Total votes | 55,843 | 100.0 | ||
| Democratic hold | ||||
| Party | Candidate | Votes | % | |
|---|---|---|---|---|
| Democratic | Virgil Smith | 42,722 | 94.47 | |
| Republican | Frederick Robinson II | 1,241 | 2.74 | |
| Independent | D. Etta Wilcoxon | 931 | 2.06 | |
| Libertarian | Raymond Warner | 329 | 0.73 | |
| Total votes | 45,223 | 100.0 | ||
| Democratic hold | ||||
| Party | Candidate | Votes | % | |
|---|---|---|---|---|
| Democratic | Tupac Hunter (incumbent) | 44,055 | 83.26 | |
| Republican | Bonnie Patrick | 8,856 | 16.74 | |
| Total votes | 52,911 | 100.0 | ||
| Democratic hold | ||||
| Party | Candidate | Votes | % | |
|---|---|---|---|---|
| Democratic | Glenn Anderson (incumbent) | 46,471 | 55.67 | |
| Republican | John Pastor | 37,001 | 44.33 | |
| Total votes | 83,472 | 100.0 | ||
| Democratic hold | ||||
| Party | Candidate | Votes | % | |
|---|---|---|---|---|
| Republican | Patrick Colbeck | 55,284 | 52.24 | |
| Democratic | Kathleen Law | 43,173 | 40.79 | |
| Independent | John Stewart | 5,508 | 5.20 | |
| Libertarian | Marlin Brandys | 1,134 | 1.07 | |
| Independent | Michael Kheibari | 734 | 0.69 | |
| Total votes | 105,833 | 100.0 | ||
| Republican hold | ||||
| Party | Candidate | Votes | % | |
|---|---|---|---|---|
| Democratic | Hoon-Yung Hopgood | 37,845 | 54.92 | |
| Republican | Ken Larkin | 25,280 | 36.68 | |
| Independent | Neil Sawicki | 4,697 | 6.82 | |
| Libertarian | Loel Gnadt | 1,093 | 1.59 | |
| Total votes | 68,915 | 100.0 | ||
| Democratic hold | ||||
| Party | Candidate | Votes | % | |
|---|---|---|---|---|
| Democratic | Steven Bieda | 42,039 | 54.34 | |
| Republican | Michael Ennis | 33,258 | 42.99 | |
| Green | Richard Kuszmar | 2,072 | 2.68 | |
| Total votes | 77,369 | 100.0 | ||
| Democratic hold | ||||
| Party | Candidate | Votes | % | |||
|---|---|---|---|---|---|---|
| Republican | Tory Rocca | 44,486 | 54.35 | |||
| Democratic | Paul Gieleghem | 37,369 | 45.65 | |||
| Total votes | 81,855 | 100.0 | ||||
| Republican gain from Democratic | ||||||
| Party | Candidate | Votes | % | |
|---|---|---|---|---|
| Republican | Jack Brandenburg | 65,403 | 65.69 | |
| Democratic | Jim Ayres | 34,166 | 34.31 | |
| Total votes | 99,569 | 100.0 | ||
| Republican hold | ||||
| Party | Candidate | Votes | % | |
|---|---|---|---|---|
| Republican | Jim Marleau | 56,894 | 60.90 | |
| Democratic | Casandra Ulbrich | 36,526 | 39.10 | |
| Total votes | 93,420 | 100.0 | ||
| Republican hold | ||||
| Party | Candidate | Votes | % | |
|---|---|---|---|---|
| Republican | John Pappageorge (incumbent) | 62,324 | 59.27 | |
| Democratic | Aaron Bailey | 42,830 | 40.73 | |
| Total votes | 105,154 | 100.0 | ||
| Republican hold | ||||
| Party | Candidate | Votes | % | |
|---|---|---|---|---|
| Democratic | Vincent Gregory | 62,863 | 64.66 | |
| Republican | Michael Peters | 31,944 | 32.86 | |
| Green | Karen Anne Shelley | 2,415 | 2.48 | |
| Total votes | 97,222 | 100.0 | ||
| Democratic hold | ||||
| Party | Candidate | Votes | % | |
|---|---|---|---|---|
| Republican | Mike Kowall | 65,216 | 62.44 | |
| Democratic | Pam Jackson | 39,233 | 37.56 | |
| Total votes | 104,449 | 100.0 | ||
| Republican hold | ||||
| Party | Candidate | Votes | % | |
|---|---|---|---|---|
| Republican | Bruce Caswell | 47,504 | 64.47 | |
| Democratic | Doug Spade | 26,181 | 35.53 | |
| Total votes | 73,685 | 100.0 | ||
| Republican hold | ||||
| Party | Candidate | Votes | % | |
|---|---|---|---|---|
| Republican | Randy Richardville (incumbent) | 51,657 | 59.33 | |
| Democratic | John Spencer | 32,980 | 37.88 | |
| Libertarian | Ronald Muszynski | 2,425 | 2.79 | |
| Total votes | 87,062 | 100.0 | ||
| Republican hold | ||||
| Party | Candidate | Votes | % | |
|---|---|---|---|---|
| Democratic | Rebekah Warren | 60,333 | 65.51 | |
| Republican | John Hochstetler | 31,771 | 34.49 | |
| Total votes | 92,104 | 100.0 | ||
| Democratic hold | ||||
| Party | Candidate | Votes | % | |
|---|---|---|---|---|
| Republican | Mike Nofs (incumbent) | 46,543 | 63.58 | |
| Democratic | Brenda Abbey | 26,657 | 36.42 | |
| Total votes | 73,200 | 100.0 | ||
| Republican hold | ||||
| Party | Candidate | Votes | % | |
|---|---|---|---|---|
| Republican | Tonya Schuitmaker | 47,680 | 58.01 | |
| Democratic | Bobby Hopewell | 34,507 | 41.99 | |
| Total votes | 82,187 | 100.0 | ||
| Republican hold | ||||
| Party | Candidate | Votes | % | |
|---|---|---|---|---|
| Republican | John Proos | 49,818 | 66.53 | |
| Democratic | Scott Elliott | 25,062 | 33.47 | |
| Total votes | 74,880 | 100.0 | ||
| Republican hold | ||||
| Party | Candidate | Votes | % | |
|---|---|---|---|---|
| Republican | Joe Hune | 65,170 | 66.71 | |
| Democratic | Chuck Fellows | 29,325 | 30.02 | |
| Libertarian | Todd Richardson | 3,201 | 3.29 | |
| Total votes | 97,696 | 100.0 | ||
| Republican hold | ||||
| Party | Candidate | Votes | % | |
|---|---|---|---|---|
| Democratic | Gretchen Whitmer (incumbent) | 49,990 | 63.99 | |
| Republican | Kyle Haubrich | 28,133 | 36.01 | |
| Total votes | 78,123 | 100.0 | ||
| Democratic hold | ||||
| Party | Candidate | Votes | % | |
|---|---|---|---|---|
| Republican | Rick Jones | 64,039 | 65.68 | |
| Democratic | Michelle Disano | 30,052 | 30.82 | |
| Libertarian | Bradley Cook | 3,413 | 3.50 | |
| Total votes | 97,504 | 100.0 | ||
| Republican hold | ||||
| Party | Candidate | Votes | % | |
|---|---|---|---|---|
| Republican | Phil Pavlov | 53,342 | 66.90 | |
| Democratic | John Nugent | 26,393 | 33.10 | |
| Total votes | 79,735 | 100.0 | ||
| Republican hold | ||||
| Party | Candidate | Votes | % | |||
|---|---|---|---|---|---|---|
| Republican | Dave Robertson | 49,700 | 55.00 | |||
| Democratic | Paula Zelenko | 36,231 | 40.10 | |||
| Independent | Mark Sanborn | 4,427 | 4.90 | |||
| Total votes | 90,358 | 100.0 | ||||
| Republican gain from Democratic | ||||||
| Party | Candidate | Votes | % | |
|---|---|---|---|---|
| Democratic | John Gleason (incumbent) | 51,666 | 66.45 | |
| Republican | Vernon Molnar | 23,920 | 30.76 | |
| Libertarian | Pat Clawson | 2,168 | 2.79 | |
| Total votes | 77,754 | 100.0 | ||
| Democratic hold | ||||
| Party | Candidate | Votes | % | |
|---|---|---|---|---|
| Republican | Mark Jansen (incumbent) | 74,529 | 71.75 | |
| Democratic | Robin Golden | 26,276 | 25.30 | |
| Libertarian | Jamie Lewis | 3,069 | 2.95 | |
| Total votes | 103,874 | 100.0 | ||
| Republican hold | ||||
| Party | Candidate | Votes | % | |
|---|---|---|---|---|
| Republican | Dave Hildenbrand | 41,042 | 51.77 | |
| Democratic | David LaGrand | 36,830 | 46.46 | |
| Libertarian | Bill Gelineau | 1,406 | 1.77 | |
| Total votes | 79,278 | 100.0 | ||
| Republican hold | ||||
| Party | Candidate | Votes | % | |
|---|---|---|---|---|
| Republican | Arlan Meekhof | 74,409 | 76.30 | |
| Democratic | John Chester | 20,061 | 20.57 | |
| Libertarian | Bruce Campbell | 3,058 | 3.14 | |
| Total votes | 97,528 | 100.0 | ||
| Republican hold | ||||
| Party | Candidate | Votes | % | |||
|---|---|---|---|---|---|---|
| Republican | Mike Green | 51,678 | 58.52 | |||
| Democratic | Jeff Mayes | 36,629 | 41.48 | |||
| Total votes | 88,307 | 100.0 | ||||
| Republican gain from Democratic | ||||||
| Party | Candidate | Votes | % | |
|---|---|---|---|---|
| Republican | Roger Kahn, M.D. (incumbent) | 43,577 | 55.45 | |
| Democratic | Debasish Mridha, M.D. | 32,692 | 41.60 | |
| Constitution | Keith Beyerlein | 1,618 | 2.06 | |
| Libertarian | Albert Chia | 702 | 0.89 | |
| Total votes | 78,589 | 100.0 | ||
| Republican hold | ||||
| Party | Candidate | Votes | % | |
|---|---|---|---|---|
| Republican | Judy Emmons | 50,222 | 64.53 | |
| Democratic | James Hoisington | 25,206 | 32.39 | |
| Libertarian | Joshua Lillie | 2,403 | 3.09 | |
| Total votes | 77,831 | 100.0 | ||
| Republican hold | ||||
| Party | Candidate | Votes | % | |
|---|---|---|---|---|
| Republican | Goeff Hansen | 49,065 | 58.11 | |
| Democratic | Mary Valentine | 33,261 | 39.39 | |
| Libertarian | Nicholas Sundquist | 2,108 | 2.50 | |
| Total votes | 84,434 | 100.0 | ||
| Republican hold | ||||
| Party | Candidate | Votes | % | |
|---|---|---|---|---|
| Republican | Darwin L. Booher | 56,318 | 62.81 | |
| Democratic | Roger Dunigan | 30,819 | 34.37 | |
| Libertarian | Allitta Hren | 2,521 | 2.81 | |
| Total votes | 89,658 | 100.0 | ||
| Republican hold | ||||
| Party | Candidate | Votes | % | |
|---|---|---|---|---|
| Republican | John Moolenaar | 56,634 | 63.79 | |
| Democratic | Andy Neumann | 32,154 | 36.21 | |
| Total votes | 88,788 | 100.0 | ||
| Republican hold | ||||
| Party | Candidate | Votes | % | |
|---|---|---|---|---|
| Republican | Howard Walker | 62,697 | 64.76 | |
| Democratic | Bob Carr | 34,122 | 35.24 | |
| Total votes | 96,819 | 100.0 | ||
| Republican hold | ||||
| Party | Candidate | Votes | % | |||
|---|---|---|---|---|---|---|
| Republican | Tom Casperson | 49,868 | 55.91 | |||
| Democratic | Michael Lahti | 39,320 | 44.09 | |||
| Total votes | 89,188 | 100.0 | ||||
| Republican gain from Democratic | ||||||
27th District by-election
State Senator John Gleason resigned his seat to accept election as the Genesee County Clerk. This triggered a by-election, which was held May 7, 2013. Jim Ananich won the special election with 75.27% of the vote.[3]
| Party | Candidate | Votes | % | |
|---|---|---|---|---|
| Democratic | Jim Ananich | 8,728 | 75.27 | |
| Republican | Robert J. Daunt | 2,640 | 22.77 | |
| Libertarian | Robert Nicholls | 143 | 1.23 | |
| Green | Bobby Jones | 80 | 0.69 | |
| Write-In | 4 | 0.03 | ||
| Total votes | 11,595 | 100 | ||
| Democratic hold | ||||
See also
References
- ^ Jacobson, Louis (November 1, 2010). "Update: 2010 State Legislatures: A Challenging Environment for Democrats". Governing. Archived from the original on December 5, 2010. Retrieved July 14, 2024.
- ^ "2010 Michigan Election Results - General". Michigan Secretary of State. September 28, 2016. Archived from the original on February 10, 2025. Retrieved February 27, 2025.
- ^ "2013 Special Election Results" (PDF). Genesee County. May 10, 2013. Retrieved December 31, 2014.