2015 Daventry District Council election
| |||||||||||||||||||||||||||||||||||||||||
All 36 seats in the Daventry District Council 19 seats needed for a majority | |||||||||||||||||||||||||||||||||||||||||
|---|---|---|---|---|---|---|---|---|---|---|---|---|---|---|---|---|---|---|---|---|---|---|---|---|---|---|---|---|---|---|---|---|---|---|---|---|---|---|---|---|---|
| |||||||||||||||||||||||||||||||||||||||||
 Results of the 2015 Daventry District Council election | |||||||||||||||||||||||||||||||||||||||||
| |||||||||||||||||||||||||||||||||||||||||
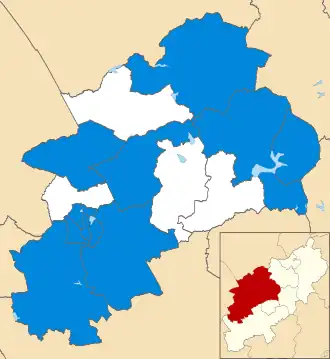
The 2015 Daventry District Council election took place on 7 May 2015 to elect members of Daventry District Council in England.[1] This was on the same day as other local elections. Two seats changed hands with the Conservatives taking both from Labour leading to the council being made up as follows; 31 Conservative councillors, 2 Labour councillors, 2 UKIP councillors and 1 Liberal Democrat councillor.
Election result
| Party | Seats | Gains | Losses | Net gain/loss | Seats % | Votes % | Votes | +/− | |
|---|---|---|---|---|---|---|---|---|---|
| Conservative | 12 | 2 | 0 | +2 | 100.0 | 56.0 | 19,777 | ||
| Labour | 0 | 0 | 2 | -2 | 0.0 | 22.3 | 7,889 | ||
| UKIP | 0 | 0 | 0 | 0 | 0.0 | 12.8 | 4,530 | ||
| Green | 0 | 0 | 0 | 0 | 0.0 | 4.1 | 1,445 | ||
| Liberal Democrats | 0 | 0 | 0 | 0 | 0.0 | 3.5 | 1,244 | ||
| Independent | 0 | 0 | 0 | 0 | 0.0 | 1.3 | 450 | ||
Ward results
Abbey North
| Party | Candidate | Votes | % | ±% | |
|---|---|---|---|---|---|
| Conservative | David Thomas James | 1299 | 44.1 | ||
| Labour | Maureen Luke | 871 | 29.6 | ||
| UKIP | Peter John Scriven | 757 | 25.7 | ||
| Majority | 542 | 14.5 | |||
| Turnout | 2943 | 55.35 | |||
| Conservative gain from Labour | Swing | ||||
Abbey South
| Party | Candidate | Votes | % | ±% | |
|---|---|---|---|---|---|
| Conservative | Mark David Andrew Wesley | 1505 | 50.0 | ||
| Labour | Richard Williams | 762 | 25.3 | ||
| UKIP | Jennifer Mary Leighton | 722 | 24.7 | ||
| Majority | 743 | 24.7 | |||
| Turnout | 3007 | 60.72 | |||
| Conservative hold | Swing | ||||
Barby & Kilsby
| Party | Candidate | Votes | % | ±% | |
|---|---|---|---|---|---|
| Conservative | Ian Bradley Robertson | 1440 | 52.0 | ||
| Liberal Democrats | Brian Martin Lomax | 845 | 31.7 | ||
| Labour | Elizabeth Anne Ritchie | 450 | 16.3 | ||
| Majority | 595 | 20.3 | |||
| Turnout | 2769 | 75.61 | |||
| Conservative hold | Swing | ||||
Brixworth
| Party | Candidate | Votes | % | ±% | |
|---|---|---|---|---|---|
| Conservative | Nicholas John Bunting | 2601 | 67.2 | ||
| Labour | Robert Peter McNally | 726 | 18.8 | ||
| Green | Stephen John Whiffen | 517 | 13.4 | ||
| Majority | 1875 | 48.4 | |||
| Turnout | 3870 | 72.72 | |||
| Conservative hold | Swing | ||||
Drayton
| Party | Candidate | Votes | % | ±% | |
|---|---|---|---|---|---|
| Conservative | Amy Howard | 1018 | 36.4 | ||
| Labour | Ken Ritchie | 885 | 31.7 | ||
| UKIP | Stephen Pointer | 609 | 21.8 | ||
| Liberal Democrats | Inge Nina Freudenreich | 96 | 3.4 | ||
| Independent | Timothy Eric Wilson | 175 | 6.3 | ||
| Majority | 133 | 4.7 | |||
| Turnout | 2793 | 61.12 | |||
| Conservative hold | Swing | ||||
Hill
| Party | Candidate | Votes | % | ±% | |
|---|---|---|---|---|---|
| Conservative | Wayne Howard | 1233 | 49.7 | ||
| Labour | Michael John Arnold | 644 | 26.0 | ||
| UKIP | Eric Macanndrais | 589 | 23.8 | ||
| Majority | 589 | 23.7 | |||
| Turnout | 2479 | 58.61 | |||
| Conservative hold | Swing | ||||
Long Buckby
| Party | Candidate | Votes | % | ±% | |
|---|---|---|---|---|---|
| Conservative | Diana Osborne | 2075 | 54.1 | ||
| Labour | Chris Myers | 962 | 25.1 | ||
| UKIP | Ian Robert James Dexter | 774 | 20.2 | ||
| Majority | 1113 | 29.0 | |||
| Turnout | 3838 | 73.41 | |||
| Conservative hold | Swing | ||||
Moulton
| Party | Candidate | Votes | % | ±% | |
|---|---|---|---|---|---|
| Conservative | Daniel Cribbin | 1623 | 64.6 | ||
| Labour | Mark Anthony Gunther Maryan | 497 | 19.8 | ||
| Green | Pamela Booker | 367 | 14.6 | ||
| Majority | 1126 | 44.8 | |||
| Turnout | 2514 | 70.42 | |||
| Conservative hold | Swing | ||||
Walgrave
| Party | Candidate | Votes | % | ±% | |
|---|---|---|---|---|---|
| Conservative | Ann Carter | 731 | 59.1 | −10.7 | |
| Labour | Peter Luke | 145 | 11.7 | −18.1 | |
| Green | Stuart Tite | 75 | 6.1 | +6.1 | |
| Independent | Kevin Simons | 275 | 22.2 | +22.2 | |
| Majority | 456 | 36.3 | −3.7 | ||
| Turnout | 1236 | 76.58 | +41.7 | ||
| Conservative hold | Swing | ||||
Weedon
| Party | Candidate | Votes | % | ±% | |
|---|---|---|---|---|---|
| Conservative | John Amos | 2181 | 57.4 | ||
| Labour | Raymond Ogden | 619 | 16.3 | ||
| UKIP | John Gale | 684 | 18.0 | ||
| Liberal Democrats | Chris Salaman | 303 | 8.0 | ||
| Majority | 1497 | 41.1 | |||
| Turnout | 3800 | 74.54 | |||
| Conservative hold | Swing | ||||
Welford
| Party | Candidate | Votes | % | ±% | |
|---|---|---|---|---|---|
| Conservative | Richard Auger | 1672 | 64.3 | ||
| Labour | Sue Myers | 520 | 20.0 | ||
| UKIP | Pamela Booker | 395 | 15.2 | ||
| Majority | 1152 | 44.3 | |||
| Turnout | 2600 | 78.27 | |||
| Conservative hold | Swing | ||||
Woodford
| Party | Candidate | Votes | % | ±% | |
|---|---|---|---|---|---|
| Conservative | Joanne Gilford | 2399 | 64.4 | ||
| Labour | Emma Marsh | 808 | 21.7 | ||
| Green | Nikita Webb | 486 | 13.0 | ||
| Majority | 1591 | 42.7 | |||
| Turnout | 3727 | 69.12 | |||
| Conservative hold | Swing | ||||
References
- ^ "Election Results 2015". The Electoral Commission. Archived from the original on 15 March 2015. Retrieved 21 November 2017.
| North Northamptonshire Council | |
|---|---|
| West Northamptonshire Council | |
| Northamptonshire County Council | |
| Corby Borough Council | |
| Daventry District Council | |
| East Northamptonshire District Council | |
| Kettering Borough Council | |
| Northampton Borough Council | |
| South Northamptonshire District Council |
|
| Wellingborough Borough Council | |
| |