2015 Lewes District Council election
| ||||||||||||||||||||||||||||||||||||||||||||||||||||||||||||||||||||
All 41 seats to Lewes District Council 21 seats needed for a majority | ||||||||||||||||||||||||||||||||||||||||||||||||||||||||||||||||||||
|---|---|---|---|---|---|---|---|---|---|---|---|---|---|---|---|---|---|---|---|---|---|---|---|---|---|---|---|---|---|---|---|---|---|---|---|---|---|---|---|---|---|---|---|---|---|---|---|---|---|---|---|---|---|---|---|---|---|---|---|---|---|---|---|---|---|---|---|---|
| ||||||||||||||||||||||||||||||||||||||||||||||||||||||||||||||||||||
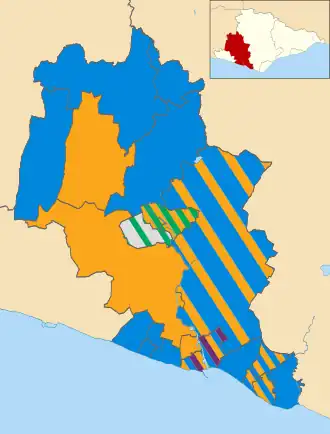 Results of the 2015 Lewes District Council election | ||||||||||||||||||||||||||||||||||||||||||||||||||||||||||||||||||||
| ||||||||||||||||||||||||||||||||||||||||||||||||||||||||||||||||||||
The 2015 Lewes District Council election took place on 7 May 2015 to elect members of Lewes District Council in England.[1] This was on the same day as other local elections.
Results summary
| Lewes District Council election, 2015[2] | |||||||||||||||
|---|---|---|---|---|---|---|---|---|---|---|---|---|---|---|---|
| Party | Candidates | Votes | |||||||||||||
| Stood | Elected | Gained | Unseated | Net | % of total | % | No. | Net % | |||||||
| Conservative | 39 | 24 | 3 | 1 | 58.5% | 34.5% | 35,938 | ||||||||
| Liberal Democrats | 36 | 11 | 1 | 8 | 26.8% | 23.8% | 24,817 | ||||||||
| Green | 26 | 3 | 3 | 0 | 7.3% | 10.5% | 10,955 | ||||||||
| Independent | 9 | 2 | 1 | 0 | 4.9% | 6.5% | 6,805 | ||||||||
| UKIP | 27 | 1 | 1 | 0 | 2.4% | 13.6% | 14,137 | ||||||||
| Labour | 21 | 0 | 0 | 0 | 0% | 11.0% | 11,479 | ||||||||
Ward results
Sitting councillors are marked with an asterisk (*).
Barcombe & Hamsey
| Party | Candidate | Votes | % | ±% | |
|---|---|---|---|---|---|
| Conservative | Isabelle Linington | 511 | 41.3 | –3.5 | |
| Liberal Democrats | Marion Joyce Hughes | 492 | 39.8 | +2.6 | |
| Green | Neil del Strother | 233 | 18.9 | +0.9 | |
| Majority | 19 | 1.5 | –6.1 | ||
| Turnout | |||||
| Conservative hold | Swing | ||||
Chailey & Wivelsfield
| Party | Candidate | Votes | % | ±% | |
|---|---|---|---|---|---|
| Conservative | Sharon Davy * | 1,686 | 48.7 | –9.2 | |
| Conservative | Cyril Sugarman * | 1,169 | – | ||
| Liberal Democrats | Lesley Alison Dunford | 893 | 25.8 | +6.3 | |
| UKIP | Pascal Atkins | 463 | 13.4 | N/A | |
| Liberal Democrats | Iantha Kirkup | 444 | – | ||
| Green | Holly Atkins | 417 | 12.1 | –0.8 | |
| Turnout | |||||
| Conservative hold | Swing | ||||
| Conservative hold | Swing | ||||
Ditchling & Westmeston
| Party | Candidate | Votes | % | ±% | |
|---|---|---|---|---|---|
| Conservative | Tom Jones * | 1,032 | 67.0 | +7.7 | |
| Liberal Democrats | Don McBeth | 259 | 16.8 | +0.8 | |
| Green | Tom Beament | 162 | 10.5 | –14.1 | |
| Labour | Vincent Tickner | 88 | 5.7 | N/A | |
| Majority | 773 | 50.2 | +15.5 | ||
| Turnout | |||||
| Conservative hold | Swing | ||||
East Saltdean & Telscombe Cliffs
| Party | Candidate | Votes | % | ±% | |
|---|---|---|---|---|---|
| Conservative | Wayne Botting | 1,875 | 43.7 | –6.2 | |
| Conservative | Ron Maskell * | 1,825 | – | ||
| Conservative | Andy Smith * | 1,654 | – | ||
| Labour | Alan Ford | 923 | 21.5 | –2.1 | |
| Labour | Christine Robinson | 875 | – | ||
| Labour | Laurence O'Connor | 864 | – | ||
| UKIP | David Michael Burgess | 685 | 16.0 | N/A | |
| UKIP | Lyn Mills | 613 | – | ||
| UKIP | Josh Palmer | 520 | – | ||
| Liberal Democrats | Simon Marriott Ackroyd | 432 | 10.1 | –16.5 | |
| Green | Sarah Rosalind Hitchings | 378 | 8.8 | N/A | |
| Turnout | |||||
| Conservative hold | Swing | ||||
| Conservative hold | Swing | ||||
| Conservative hold | Swing | ||||
Kingston
| Party | Candidate | Votes | % | ±% | |
|---|---|---|---|---|---|
| Liberal Democrats | Vic Ient | 576 | 44.4 | +3.0 | |
| Conservative | Nick Robinson | 423 | 32.6 | –1.7 | |
| Green | Luci McGovern | 297 | 22.9 | +11.0 | |
| Majority | 153 | 11.8 | +4.7 | ||
| Turnout | |||||
| Liberal Democrats hold | Swing | ||||
Lewes Bridge
| Party | Candidate | Votes | % | ±% | |
|---|---|---|---|---|---|
| Liberal Democrats | Daisy Cooper | 905 | 27.5 | –10.9 | |
| Green | Joanna Katherine Emma Carter | 677 | 20.6 | –9.5 | |
| Liberal Democrats | John Tregea Lamb | 641 | – | ||
| Independent | Matt Kent | 540 | 16.4 | N/A | |
| Labour | Denzil Jones | 529 | 16.1 | –0.8 | |
| Labour | Gill Short | 447 | – | ||
| Green | Robert Lewis Heath | 410 | – | ||
| Conservative | Brenda Gough | 395 | 12.0 | –2.6 | |
| Conservative | Frances Tufnell | 359 | – | ||
| UKIP | Deborah Anna Cooke | 240 | 7.3 | N/A | |
| Turnout | |||||
| Liberal Democrats hold | Swing | ||||
| Green gain from Liberal Democrats | Swing | ||||
Lewes Castle
| Party | Candidate | Votes | % | ±% | |
|---|---|---|---|---|---|
| Green | Susan Jean Murray | 767 | 28.4 | –1.5 | |
| Liberal Democrats | Mike Chartier * | 764 | 28.3 | –11.8 | |
| Green | Annabella Sarah Ashby | 703 | – | ||
| Liberal Democrats | David Michael Gray * | 612 | – | ||
| Labour | Linda Drabble | 448 | 16.6 | –1.1 | |
| Labour | Philippa Thompson | 439 | – | ||
| Independent | Jacqueline Bishop | 384 | 14.2 | N/A | |
| Conservative | Marion Fuller | 336 | 12.4 | – | |
| Conservative | Jane Slater | 273 | – | ||
| Independent | Rod Crocker | 207 | – | ||
| Turnout | |||||
| Green gain from Liberal Democrats | Swing | ||||
| Liberal Democrats hold | Swing | ||||
Lewes Priory
| Party | Candidate | Votes | % | ±% | |
|---|---|---|---|---|---|
| Independent | Ruth O'Keeffe * | 2,702 | 49.5 | +3.0 | |
| Green | Tony Rowell | 1,141 | 20.9 | +7.0 | |
| Independent | Stephen Alfred Catlin | 1,111 | – | ||
| Green | Imogen Makepeace | 1,001 | – | ||
| Independent | Graham John Mayhew | 999 | – | ||
| Green | Adam Kenneth Barker | 909 | – | ||
| Labour | Louis Blair | 647 | 11.8 | +1.4 | |
| Labour | Pam Lewis | 564 | – | ||
| Liberal Democrats | John Stockdale | 521 | 9.5 | –7.6 | |
| Liberal Democrats | Clive Richard Burgess | 518 | – | ||
| Labour | Gaby Weiner | 491 | – | ||
| Conservative | Cynthia Orwell | 453 | 8.3 | –0.8 | |
| Conservative | Roy Burman | 406 | – | ||
| Liberal Democrats | Will Elliott | 401 | – | ||
| Turnout | |||||
| Independent hold | Swing | ||||
| Green gain from Liberal Democrats | Swing | ||||
| Independent gain from Liberal Democrats | Swing | ||||
Newhaven Denton & Meeching
| Party | Candidate | Votes | % | ±% | |
|---|---|---|---|---|---|
| Liberal Democrats | Graham Roger Amy * | 1,327 | 28.1 | –17.4 | |
| Conservative | Bill Giles | 1,040 | 22.0 | –3.4 | |
| UKIP | Simon Barnes | 997 | 21.1 | N/A | |
| Liberal Democrats | Darren Paul Grover | 919 | – | ||
| Liberal Democrats | Keith Frederick Corbett | 877 | – | ||
| Conservative | Amber Robertson | 849 | – | ||
| UKIP | Laurence Alexander Pulling | 816 | – | ||
| UKIP | Lawrence Shaun Steer | 690 | – | ||
| Labour | Doug Johnson | 607 | 12.9 | –2.3 | |
| Labour | Jan Woodling | 576 | – | ||
| Green | John Roderick McGarrie | 413 | 8.8 | –5.1 | |
| Independent | Rod Main * | 336 | 7.1 | N/A | |
| Turnout | |||||
| Liberal Democrats hold | Swing | ||||
| Conservative gain from Liberal Democrats | Swing | ||||
| UKIP gain from Liberal Democrats | Swing | ||||
Newhaven Valley
| Party | Candidate | Votes | % | ±% | |
|---|---|---|---|---|---|
| Liberal Democrats | Julie Lynn Carr * | 616 | 36.1 | –15.9 | |
| Liberal Democrats | Steve Saunders * | 604 | – | ||
| Conservative | Tony Bradbury | 468 | 27.4 | +0.2 | |
| UKIP | Terence John Kelly | 437 | 25.6 | +4.8 | |
| UKIP | George Robert Cork | 397 | – | ||
| Conservative | Melvyn Simmons | 322 | – | ||
| Green | Amy Macconnachie | 184 | 10.8 | N/A | |
| Turnout | |||||
| Liberal Democrats hold | Swing | ||||
| Liberal Democrats hold | Swing | ||||
Newick
| Party | Candidate | Votes | % | ±% | |
|---|---|---|---|---|---|
| Conservative | Jim Sheppard * | 1,019 | 65.2 | – | |
| Liberal Democrats | Peter Edward Spain | 419 | 26.8 | +14.1 | |
| Green | Anthony Shuster | 125 | 8.0 | +1.6 | |
| Majority | 600 | 38.4 | –11.1 | ||
| Turnout | |||||
| Conservative hold | Swing | ||||
Ouse Valley & Ringmer
| Party | Candidate | Votes | % | ±% | |
|---|---|---|---|---|---|
| Liberal Democrats | Peter Frederick Gardiner * | 1,535 | 29.2 | –4.1 | |
| Conservative | Paul Gander * | 1,526 | 29.0 | –1.6 | |
| Conservative | Richard John Turner | 1,230 | – | ||
| Liberal Democrats | Charlie Carr | 1,186 | – | ||
| Liberal Democrats | Pat Ost | 1,048 | – | ||
| Conservative | Alan Lawson Scott | 965 | – | ||
| Green | Johnny Denis | 864 | 16.4 | +0.4 | |
| UKIP | Ian Wilson | 696 | 13.2 | +4.9 | |
| Labour | Peter Stephen Hambly | 641 | 12.2 | +0.4 | |
| Turnout | |||||
| Liberal Democrats hold | Swing | ||||
| Conservative hold | Swing | ||||
| Conservative gain from Liberal Democrats | Swing | ||||
Peacehaven East
| Party | Candidate | Votes | % | ±% | |
|---|---|---|---|---|---|
| Conservative | Nigel Enever | 1,116 | 41.5 | –16.1 | |
| Conservative | Jackie Harrison-Hicks * | 1,082 | – | ||
| Labour | Nicky Easton | 628 | 23.4 | –8.5 | |
| UKIP | Phil Howson * | 621 | 23.1 | N/A | |
| UKIP | Su Bratchie | 590 | – | ||
| Labour | Rotney O'Shea | 479 | – | ||
| Green | Fraser Colin Addecott | 176 | 6.6 | N/A | |
| Liberal Democrats | Wilma Joyce Shaw | 146 | 5.4 | –5.2 | |
| Turnout | |||||
| Conservative hold | Swing | ||||
| Conservative hold | Swing | ||||
Peacehaven North
| Party | Candidate | Votes | % | ±% | |
|---|---|---|---|---|---|
| Conservative | Andy Loraine | 1,024 | 40.1 | –0.9 | |
| Conservative | Elayne Merry * | 845 | – | ||
| Labour | Ann Harrison | 516 | 20.2 | –0.5 | |
| UKIP | Brian William Griffiths | 466 | 18.2 | N/A | |
| UKIP | Clive Rowland Hickman | 394 | – | ||
| Independent | Sue Griffiths | 196 | 7.7 | N/A | |
| Liberal Democrats | Roger John Leach | 178 | 7.0 | –13.1 | |
| Green | Tobias Benedict Eoghan Madden | 175 | 6.8 | N/A | |
| Turnout | |||||
| Conservative hold | Swing | ||||
| Conservative hold | Swing | ||||
Peacehaven West
| Party | Candidate | Votes | % | ±% | |
|---|---|---|---|---|---|
| Conservative | Dave Neave | 1,030 | 39.5 | –18.1 | |
| Conservative | Robbie Robertson * | 845 | – | ||
| UKIP | Ian Verdun Buchanan | 590 | 22.6 | N/A | |
| Labour | Richard Collings | 567 | 21.8 | –7.4 | |
| UKIP | Kit Griffiths | 448 | – | ||
| Green | Antonia Thornhill Madden | 215 | 8.3 | N/A | |
| Liberal Democrats | Jane Scott | 203 | 7.8 | –5.4 | |
| Turnout | |||||
| Conservative hold | Swing | ||||
| Conservative hold | Swing | ||||
Plumpton, Streat, East Chiltington & St John (Without)
| Party | Candidate | Votes | % | ±% | |
|---|---|---|---|---|---|
| Liberal Democrats | Sarah Jane Osborne * | 607 | 44.2 | –7.2 | |
| Conservative | Nancy Bikson | 565 | 41.1 | –0.2 | |
| Green | Daniel Charles Antony Renton | 202 | 14.7 | N/A | |
| Majority | 42 | 3.1 | –7.1 | ||
| Turnout | 949 | ||||
| Liberal Democrats hold | Swing | ||||
Seaford Central
| Party | Candidate | Votes | % | ±% | |
|---|---|---|---|---|---|
| Conservative | Bill Bovington | 936 | 30.7 | +7.2 | |
| Liberal Democrats | Stephen John Gauntlett * | 821 | 26.9 | –2.9 | |
| Liberal Democrats | Rahnuma Hayder | 632 | – | ||
| Conservative | Bill Webb | 605 | – | ||
| UKIP | Terry Goodman | 504 | 16.5 | +7.2 | |
| Labour | Penny Lower | 458 | 15.0 | +5.1 | |
| UKIP | Eric Charles Woodward | 350 | – | ||
| Green | Lesley Barnes Orr | 334 | 10.9 | +2.2 | |
| Turnout | |||||
| Conservative gain from Liberal Democrats | Swing | ||||
| Liberal Democrats hold | Swing | ||||
Seaford East
| Party | Candidate | Votes | % | ±% | |
|---|---|---|---|---|---|
| Conservative | Tony Nicholson * | 1,018 | 30.9 | –12.3 | |
| Conservative | Julian Peterson | 838 | – | ||
| Liberal Democrats | Stefano Diella | 789 | 24.0 | –6.0 | |
| UKIP | Alan Norman Latham | 667 | 20.3 | +4.7 | |
| Liberal Democrats | Michael Milton Gaze | 619 | – | ||
| UKIP | Peter Michael Leeming | 571 | – | ||
| Independent | Phil Boorman | 330 | 10.0 | N/A | |
| Labour | Mathew Paul Basford | 301 | 9.1 | –2.0 | |
| Green | Nicola McGilligan | 186 | 5.7 | N/A | |
| Green | Roger Murray | 116 | – | ||
| Turnout | |||||
| Conservative hold | Swing | ||||
| Conservative hold | Swing | ||||
Seaford North
| Party | Candidate | Votes | % | ±% | |
|---|---|---|---|---|---|
| Conservative | Paul Franklin * | 1,012 | 32.4 | –2.8 | |
| Liberal Democrats | Alex Lambert | 941 | 30.2 | +2.5 | |
| Conservative | David Neech | 833 | – | ||
| Liberal Democrats | Adam McLean | 809 | – | ||
| UKIP | Gill Hart | 505 | 16.2 | +5.3 | |
| UKIP | Deborah Anne Holt | 401 | – | ||
| Labour | Elaine Sammarco | 391 | 12.5 | –1.5 | |
| Green | George Stephen Briley | 272 | 8.7 | N/A | |
| Turnout | |||||
| Conservative hold | Swing | ||||
| Liberal Democrats gain from Conservative | Swing | ||||
Seaford South
| Party | Candidate | Votes | % | ±% | |
|---|---|---|---|---|---|
| Conservative | Sam Adeniji * | 1,148 | 41.0 | +3.8 | |
| Liberal Democrats | Olivia Honeyman | 856 | 30.6 | –8.2 | |
| Conservative | Rob Chambers | 853 | – | ||
| Liberal Democrats | Ian Martin Cairns | 789 | – | ||
| UKIP | Rita Mary Boswell | 434 | 15.5 | +4.3 | |
| Green | Guy McQueen | 362 | 12.9 | N/A | |
| UKIP | Alyssa Roberts | 74 | – | ||
| Turnout | |||||
| Conservative hold | Swing | ||||
| Liberal Democrats hold | Swing | ||||
Seaford West
| Party | Candidate | Votes | % | ±% | |
|---|---|---|---|---|---|
| Conservative | Rob Blackman | 1,252 | 45.2 | +5.2 | |
| Conservative | Linda Wallraven | 1,122 | – | ||
| Liberal Democrats | Richard Neil Honeyman | 752 | 27.1 | –7.3 | |
| Liberal Democrats | Cheryl Lesley White | 686 | – | ||
| UKIP | Linda Christine Lord | 531 | 19.2 | +2.9 | |
| UKIP | Peter Albert Charlton | 437 | – | ||
| Green | Michael McCoy | 236 | 8.5 | N/A | |
| Turnout | |||||
| Conservative hold | Swing | ||||
| Conservative hold | Swing | ||||
References
- ^ "Upcoming elections & referendums". The Electoral Commission. Archived from the original on 15 March 2015. Retrieved 12 April 2015.
- ^ a b c d e f g h i j k l m n o p q r s t u v "District Council Elections – 7 May 2015". lewes.gov.uk. Lewes District Council. Archived from the original on 16 October 2015. Retrieved 20 May 2020.