2016 Wirral Metropolitan Borough Council election
| |||||||||||||||||||||||||||||||||||||||||||||||||||||||||||||||||||||||||||||||||||
23 of 66 seats (One Third and one by-election) to Wirral Metropolitan Borough Council 34 seats needed for a majority | |||||||||||||||||||||||||||||||||||||||||||||||||||||||||||||||||||||||||||||||||||
|---|---|---|---|---|---|---|---|---|---|---|---|---|---|---|---|---|---|---|---|---|---|---|---|---|---|---|---|---|---|---|---|---|---|---|---|---|---|---|---|---|---|---|---|---|---|---|---|---|---|---|---|---|---|---|---|---|---|---|---|---|---|---|---|---|---|---|---|---|---|---|---|---|---|---|---|---|---|---|---|---|---|---|---|
| Turnout | 35.6% ( | ||||||||||||||||||||||||||||||||||||||||||||||||||||||||||||||||||||||||||||||||||
| |||||||||||||||||||||||||||||||||||||||||||||||||||||||||||||||||||||||||||||||||||
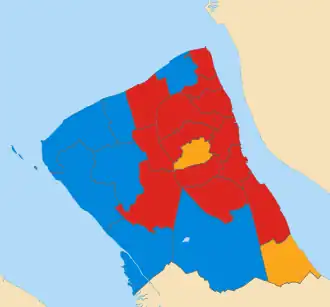 Map of results of 2016 election | |||||||||||||||||||||||||||||||||||||||||||||||||||||||||||||||||||||||||||||||||||
| |||||||||||||||||||||||||||||||||||||||||||||||||||||||||||||||||||||||||||||||||||
The 2016 Wirral Metropolitan Borough Council election took place on 5 May 2016 to elect members of Wirral Metropolitan Borough Council in England.[2] This election was held on the same day as other local elections.
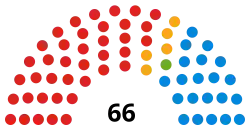
After the election, the composition of the council was:
| Party | Seats | ± | |
|---|---|---|---|
| Labour | 39 | ||
| Conservative | 21 | ||
| Liberal Democrats | 5 | ||
| Green | 1 | ||
| Independent | 0 | ||
Election results
Overall election result
Overall result compared with 2015.
| Wirral Metropolitan Borough Council election result, 2016 | |||||||||||||||
|---|---|---|---|---|---|---|---|---|---|---|---|---|---|---|---|
| Party | Candidates | Votes | |||||||||||||
| Stood | Elected | Gained | Unseated | Net | % of total | % | No. | Net % | |||||||
| Labour | 23 | 14 | 1 | 0 | 59.1 | 46.1 | 38,832 | ||||||||
| Conservative | 23 | 7 | 0 | 0 | 31.8 | 30.8 | 25,956 | ||||||||
| Liberal Democrats | 19 | 2 | 0 | 0 | 9.1 | 10.9 | 9,216 | ||||||||
| Green | 21 | 0 | 0 | 0 | 0.0 | 6.8 | 5,703 | ||||||||
| UKIP | 9 | 0 | 0 | 0 | 0.0 | 3.7 | 3,088 | ||||||||
| Independent | 1 | 0 | 0 | 1 | 0.0 | 1.2 | 985 | ||||||||
| TUSC | 7 | 0 | 0 | 0 | 0.0 | 0.5 | 394 | ||||||||
Changes in council composition
Prior to the election the composition of the council was:
| 38 | 21 | 5 | 1 | 1 |
| Lab | Con | LD | G | I |
After the election the composition of the council was:
| 39 | 21 | 5 | 1 |
| Lab | Con | LD | G |
Ward results
Results compared directly with the previous local election in 2015.
Bebington
| Party | Candidate | Votes | % | ±% | |
|---|---|---|---|---|---|
| Labour | Christina Muspratt | 2,505 | 57.0 | ||
| Conservative | Des Drury | 952 | 21.7 | ||
| UKIP | Jim Bradshaw | 516 | 11.8 | ||
| Liberal Democrats | Penelope Golby | 233 | 5.3 | ||
| Green | Anthony Smith | 187 | 4.3 | ||
| Majority | 1,553 | 35.4 | |||
| Registered electors | 11,919 | ||||
| Turnout | 4,425 | 37.1 | |||
| Rejected ballots | 32 | 0.7 | |||
| Labour hold | Swing | ||||
Bidston and St James
| Party | Candidate | Votes | % | ±% | |
|---|---|---|---|---|---|
| Labour | Julie McManus | 1,702 | 70.6 | ||
| UKIP | Debbie Caplin | 329 | 13.7 | New | |
| Conservative | Nick Hanna | 190 | 7.9 | ||
| Green | Jayne Clough | 107 | 4.4 | ||
| Liberal Democrats | Brian Gill | 82 | 3.3 | ||
| Trade_Unionist_and_Socialist_Coalition | Benjamin Halligan | 52 | 2.1 | ||
| Majority | 1,373 | 57.0 | |||
| Registered electors | 9,985 | ||||
| Turnout | 2,473 | 24.8 | |||
| Rejected ballots | 12 | 0.5 | |||
| Labour hold | Swing | ||||
Birkenhead and Tranmere
| Party | Candidate | Votes | % | ±% | |
|---|---|---|---|---|---|
| Labour | Jean Stapleton | 1,555 | 47.9 | ||
| Green | Steve Hayes | 1,383 | 42.6 | ||
| UKIP | Graeme Foster | 203 | 6.3 | ||
| Conservative | June Cowin | 59 | 1.8 | ||
| Liberal Democrats | Mary Price | 35 | 1.1 | ||
| TUSC | Jack Yarlett | 11 | 0.3 | New | |
| Majority | 172 | 5.3 | |||
| Registered electors | 9,703 | ||||
| Turnout | 3,264 | 33.6 | |||
| Rejected ballots | 18 | 0.6 | |||
| Labour hold | Swing | ||||
Bromborough
| Party | Candidate | Votes | % | ±% | |
|---|---|---|---|---|---|
| Labour | Warren Ward | 1,805 | 50.5 | ||
| Independent | Steve Niblock [n 2] | 985 | 27.6 | N/A | |
| Conservative | Pete Welch | 442 | 12.4 | ||
| Liberal Democrats | Jennifer Lane | 151 | 4.2 | ||
| Green | Percy Hogg | 131 | 3.7 | ||
| TUSC | Mark Halligan | 60 | 1.7 | ||
| Majority | 820 | 22.9 | |||
| Registered electors | 11,384 | ||||
| Turnout | 3,599 | 31.6 | |||
| Rejected ballots | 25 | 0.7 | |||
| Labour gain from Independent | Swing | ||||
Clatterbridge
| Party | Candidate | Votes | % | ±% | |
|---|---|---|---|---|---|
| Conservative | Cherry Povall | 2,333 | 51.7 | ||
| Labour | Jenny Holliday | 1,668 | 37.0 | ||
| Liberal Democrats | Jan Cambridge | 334 | 7.4 | ||
| Green | Jim McGinley | 177 | 3.9 | ||
| Majority | 665 | 14.7 | |||
| Registered electors | 11,454 | ||||
| Turnout | 4,538 | 39.6 | |||
| Rejected ballots | 26 | 0.6 | |||
| Conservative hold | Swing | ||||
Claughton
| Party | Candidate | Votes | % | ±% | |
|---|---|---|---|---|---|
| Labour | George Davies | 2,337 | 66.6 | ||
| Conservative | Barbara Sinclair | 628 | 17.9 | ||
| Liberal Democrats | Christopher Teggin | 237 | 6.8 | ||
| Green | Moira Gommon | 219 | 6.2 | ||
| TUSC | Phil Simpson | 89 | 2.5 | New | |
| Majority | 1709 | 48.7 | |||
| Registered electors | 11,161 | ||||
| Turnout | 3,372 | 31.6 | |||
| Rejected ballots | 22 | 0.6 | |||
| Labour hold | Swing | ||||
Eastham
| Party | Candidate | Votes | % | ±% | |
|---|---|---|---|---|---|
| Liberal Democrats | Phillip Gilchrist | 2,695 | 67.0 | ||
| Labour | Giuseppe Roberto | 951 | 23.6 | ||
| Conservative | Peter Taylor | 294 | 7.1 | ||
| Green | Perle Sheldricks | 83 | 2.1 | ||
| Majority | 1,744 | 43.4 | |||
| Registered electors | 10,995 | ||||
| Turnout | 4,050 | 36.8 | |||
| Rejected ballots | 27 | 0.7 | |||
| Liberal Democrats hold | Swing | ||||
Greasby, Frankby and Irby
| Party | Candidate | Votes | % | ±% | |
|---|---|---|---|---|---|
| Conservative | Tom Anderson | 2,182 | 48.5 | ||
| Labour | Frank Harrison | 1,294 | 28.8 | ||
| Liberal Democrats | John Cresswell | 792 | 17.6 | ||
| Green | Cathy Page | 232 | 5.2 | ||
| Majority | 888 | 19.7 | |||
| Registered electors | 11,369 | ||||
| Turnout | 4,529 | 39.8 | |||
| Rejected ballots | 29 | 0.6 | |||
| Conservative hold | Swing | ||||
Heswall
| Party | Candidate | Votes | % | ±% | |
|---|---|---|---|---|---|
| Conservative | Kathryn Hodson | 2,776 | 65.0 | ||
| Labour | Jeff Judge | 868 | 20.3 | ||
| Green | Barbara Burton | 334 | 7.8 | ||
| Liberal Democrats | David Tyrrell | 290 | 6.8 | ||
| Majority | 1908 | 44.7 | |||
| Registered electors | 10,768 | ||||
| Turnout | 4,304 | 40.0 | |||
| Rejected ballots | 24 | 0.6 | |||
| Conservative hold | Swing | ||||
Hoylake and Meols
| Party | Candidate | Votes | % | ±% | |
|---|---|---|---|---|---|
| Conservative | John Hale | 2,186 | 54.2 | ||
| Labour | Jean Robinson | 1,218 | 30.2 | ||
| Green | Alix Cockcroft | 372 | 9.2 | ||
| Liberal Democrats | Peter Reisdorf | 261 | 6.5 | ||
| Majority | 968 | 24.0 | |||
| Registered electors | 10,429 | ||||
| Turnout | 4,063 | 39.0 | |||
| Rejected ballots | 26 | 0.6 | |||
| Conservative hold | Swing | ||||
Leasowe and Moreton East
| Party | Candidate | Votes | % | ±% | |
|---|---|---|---|---|---|
| Labour | Anita Leech | 2,349 | 69.3 | ||
| Conservative | William Eborall | 802 | 23.7 | ||
| Green | Gillian Homeri | 240 | 7.1 | ||
| Majority | 1,547 | 45.6 | |||
| Registered electors | 10,690 | ||||
| Turnout | 3,413 | 31.9 | |||
| Rejected ballots | 22 | 0.6 | |||
| Labour hold | Swing | ||||
Liscard
| Party | Candidate | Votes | % | ±% | |
|---|---|---|---|---|---|
| Labour | Tom Usher [n 3] | 2,240 | 55.3 | ||
| Labour | Janette Williamson [n 4] | 1,672 | – | – | |
| Conservative | Ann Lavin | 690 | 17.0 | New | |
| UKIP | Lynda Williams | 504 | 12.4 | ||
| Conservative | Ann Parry | 427 | – | – | |
| Green | Trevor Desrosiers | 338 | 8.3 | ||
| Liberal Democrats | Daniel Clein | 280 | 6.9 | ||
| Majority | 1,550 | 38.3 | |||
| Registered electors | 10,982 | ||||
| Turnout | 3,604 | 32.8 | |||
| Rejected ballots | 12 | 0.3 | |||
| Labour hold | Swing | ||||
| Labour hold | Swing | – | |||
Moreton West and Saughall Massie
| Party | Candidate | Votes | % | ±% | |
|---|---|---|---|---|---|
| Conservative | Chris Blakeley | 2,384 | 56.8 | ||
| Labour | Karl Greaney | 1,425 | 34.0 | ||
| UKIP | Beryl Jones | 301 | 7.2 | ||
| Green | Lindsey Stowell-Smith | 86 | 2.0 | ||
| Majority | 959 | 22.8 | |||
| Registered electors | 10,682 | ||||
| Turnout | 4,213 | 39.4 | |||
| Rejected ballots | 17 | 0.4 | |||
| Conservative hold | Swing | ||||
New Brighton
| Party | Candidate | Votes | % | ±% | |
|---|---|---|---|---|---|
| Labour | Tony Jones | 2,214 | 51.9 | ||
| Conservative | Tony Pritchard | 1,452 | 34.1 | ||
| UKIP | Paula Walters | 257 | 6.0 | ||
| Green | Cynthia Stonall | 197 | 4.6 | ||
| Liberal Democrats | Jackie Usher | 93 | 2.2 | New | |
| TUSC | Gregory North | 51 | 1.2 | New | |
| Majority | 762 | 17.8 | |||
| Registered electors | 10,946 | ||||
| Turnout | 4,280 | 39.1 | |||
| Rejected ballots | 16 | 0.4 | |||
| Labour hold | Swing | ||||
Oxton
| Party | Candidate | Votes | % | ±% | |
|---|---|---|---|---|---|
| Liberal Democrats | Stuart Kelly | 2,381 | 54.0 | ||
| Labour | Vicky Nowak | 1,568 | 35.6 | ||
| Conservative | Philip Merry | 275 | 6.2 | ||
| Green | Liz Heydon | 183 | 4.2 | ||
| Majority | 813 | 18.4 | N/A | ||
| Registered electors | 11,044 | ||||
| Turnout | 4,434 | 40.1 | |||
| Rejected ballots | 27 | 0.6 | |||
| Liberal Democrats hold | Swing | ||||
Pensby and Thingwall
| Party | Candidate | Votes | % | ±% | |
|---|---|---|---|---|---|
| Labour | Mike Sullivan | 2,243 | 48.5 | ||
| Conservative | Andrew Gardner | 1,541 | 33.3 | ||
| UKIP | Jan Davison | 417 | 9.0 | ||
| Liberal Democrats | Damien Cummins | 296 | 6.4 | ||
| Green | Allen Burton | 125 | 2.7 | ||
| Majority | 702 | 15.2 | |||
| Registered electors | 10,388 | ||||
| Turnout | 4,651 | 44.8 | |||
| Rejected ballots | 29 | 0.6 | |||
| Labour hold | Swing | ||||
Prenton
| Party | Candidate | Votes | % | ±% | |
|---|---|---|---|---|---|
| Labour | Tony Norbury | 2,028 | 60.3 | ||
| Conservative | Hilary Jones | 647 | 19.2 | ||
| Liberal Democrats | Allan Brame | 355 | 10.6 | ||
| Green | Christopher Cooke | 334 | 9.9 | ||
| Majority | 1,381 | 41.1 | |||
| Registered electors | 10,680 | ||||
| Turnout | 3,401 | 31.8 | |||
| Rejected ballots | 37 | 1.1 | |||
| Labour hold | Swing | ||||
Rock Ferry
| Party | Candidate | Votes | % | ±% | |
|---|---|---|---|---|---|
| Labour | Bill Davies | 1,642 | 66.8 | ||
| UKIP | Billy Foster | 327 | 13.3 | ||
| Conservative | Robert Hughes | 209 | 8.5 | ||
| Green | Kenny Peers | 158 | 6.4 | ||
| Liberal Democrats | Edward Smith | 86 | 3.5 | ||
| TUSC | Leah Halligan | 38 | 1.5 | ||
| Majority | 1,315 | 53.4 | |||
| Registered electors | 9,641 | ||||
| Turnout | 2,480 | 25.7 | |||
| Rejected ballots | 20 | 0.8 | |||
| Labour hold | Swing | ||||
Seacombe
| Party | Candidate | Votes | % | ±% | |
|---|---|---|---|---|---|
| Labour | Paul Stuart | 2,245 | 85.3 | ||
| Conservative | John Laing | 386 | 14.7 | ||
| Majority | 1,859 | 70.7 | |||
| Registered electors | 10,091 | ||||
| Turnout | 2,690 | 26.7 | |||
| Rejected ballots | 59 | 2.2 | |||
| Labour hold | Swing | ||||
Upton
| Party | Candidate | Votes | % | ±% | |
|---|---|---|---|---|---|
| Labour | Matthew Patrick | 2,218 | 61.0 | ||
| Conservative | Geoffrey Gubb | 900 | 24.7 | ||
| Green | Lily Clough | 256 | 7.0 | ||
| Liberal Democrats | Alan Davies | 169 | 4.6 | ||
| TUSC | Philip Jones | 94 | 2.6 | New | |
| Majority | 1,318 | 36.3 | |||
| Registered electors | 12,181 | ||||
| Turnout | 3,693 | 30.3 | |||
| Rejected ballots | 56 | 1.5 | |||
| Labour hold | Swing | ||||
Wallasey
| Party | Candidate | Votes | % | ±% | |
|---|---|---|---|---|---|
| Conservative | Ian Lewis | 2,249 | 50.1 | ||
| Labour | Bill McGenity | 1,574 | 35.1 | ||
| Green | John Rodgers | 241 | 5.4 | ||
| UKIP | Adam Heatherington | 234 | 5.2 | ||
| Liberal Democrats | John Codling | 191 | 4.3 | ||
| Majority | 675 | 15.0 | |||
| Registered electors | 11,672 | ||||
| Turnout | 4,508 | 38.6 | |||
| Rejected ballots | 19 | 0.4 | |||
| Conservative hold | Swing | ||||
West Kirby and Thurstaston
| Party | Candidate | Votes | % | ±% | |
|---|---|---|---|---|---|
| Conservative | Geoffrey Watt | 2,379 | 57.5 | ||
| Labour | James Laing | 1,182 | 28.6 | ||
| Green | Yvonne McGinley | 320 | 7.7 | ||
| Liberal Democrats | Mike Redfern | 255 | 6.2 | ||
| Majority | 1,197 | 28.9 | |||
| Registered electors | 10,198 | ||||
| Turnout | 4,162 | 40.8 | |||
| Rejected ballots | 26 | 0.6 | |||
| Conservative hold | Swing | ||||
Changes between 2016 and 2018
Claughton by-election 2017
| Party | Candidate | Votes | % | ±% | |
|---|---|---|---|---|---|
| Labour | Gillian Wood | 1,761 | 52.4 | ||
| Liberal Democrats | David Evans | 740 | 22.0 | ||
| Conservative | Barbara Sinclair | 567 | 16.9 | ||
| Green | Liz Heydon | 136 | 4.1 | ||
| UK_Independence_Party | Beryl Jones | 130 | 3.9 | New | |
| TUSC | Leon Wheddon | 27 | 0.8 | ||
| Majority | 976 | 30.4 | |||
| Registered electors | 11,336 | ||||
| Turnout | 3,372 | 29.7 | |||
| Rejected ballots | 11 | 0.3 | |||
| Labour hold | Swing | ||||
Notes
- ^ % of total refers to % of wards won.
- ^ Deselected by Labour Party.
- ^ Elected to serve a 4-year term.
- ^ Elected to serve a 2-year term.
• italics denote the sitting councillor • bold denotes the winning candidate
References
- ^ a b "Local Election Summaries 2016". The Elections Centre. Retrieved 16 December 2018.
- ^ a b "Election results by party, Local election - Thursday, 5th May 2016". Wirral Metropolitan Borough Council.
- ^ "Council compositions". The Elections Centre. Retrieved 9 January 2018.
- ^ "Election results for Bebington". Wirral Metropolitan Borough Council.
- ^ "Councillor Christina Muspratt". Wirral Metropolitan Borough Council. Archived from the original on 12 July 2018. Retrieved 12 July 2018.
- ^ "Election results for Bidston and St James". Wirral Metropolitan Borough Council.
- ^ "Councillor Julie McManus". Wirral Metropolitan Borough Council.
- ^ "Election results for Birkenhead and Tranmere". Wirral Metropolitan Borough Council.
- ^ "Councillor Jean Stapleton". Wirral Metropolitan Borough Council. Archived from the original on 12 June 2018. Retrieved 12 July 2018.
- ^ "Councillor Stephen Hayes". Wirral Metropolitan Borough Council. Retrieved 8 May 2019.
- ^ "Election results for Bromborough". Wirral Metropolitan Borough Council.
- ^ "Councillor Warren Ward". Wirral Metropolitan Borough Council.
- ^ "Councillor Steve Niblock". Wirral Metropolitan Borough Council. Archived from the original on 17 June 2018. Retrieved 12 July 2018.
- ^ "Election results for Clatterbridge". Wirral Metropolitan Borough Council.
- ^ "Councillor Cherry Povall, JP". Wirral Metropolitan Borough Council.
- ^ "Election results for Claughton". Wirral Metropolitan Borough Council.
- ^ "Councillor George Davies". Wirral Metropolitan Borough Council.
- ^ "Election results for Eastham". Wirral Metropolitan Borough Council.
- ^ "Councillor Phil Gilchrist". Wirral Metropolitan Borough Council.
- ^ "Election results for Greasby, Frankby and Irby". Wirral Metropolitan Borough Council.
- ^ "Councillor Tom Anderson". Wirral Metropolitan Borough Council. Archived from the original on 21 May 2018. Retrieved 17 July 2018.
- ^ "Election results for Heswall". Wirral Metropolitan Borough Council.
- ^ "Councillor Kathy Hodson". Wirral Metropolitan Borough Council.
- ^ "Election results for Hoylake and Meols". Wirral Metropolitan Borough Council.
- ^ "Councillor John Hale". Wirral Metropolitan Borough Council. Archived from the original on 5 July 2018. Retrieved 17 July 2018.
- ^ "Councillor Jean Robinson". Wirral Metropolitan Borough Council.
- ^ "Councillor Peter Reisdorf". Wirral Metropolitan Borough Council. Archived from the original on 12 June 2018. Retrieved 17 July 2018.
- ^ "Election results for Leasowe and Moreton East". Wirral Metropolitan Borough Council.
- ^ "Councillor Anita Leech". Wirral Metropolitan Borough Council. Archived from the original on 17 July 2018. Retrieved 17 July 2018.
- ^ "Election results for Liscard". Wirral Metropolitan Borough Council.
- ^ "Councillor Thomas Usher". Wirral Metropolitan Borough Council.
- ^ "Councillor Janette Williamson". Wirral Metropolitan Borough Council.
- ^ "Election results for Moreton West and Saughall Massie". Wirral Metropolitan Borough Council.
- ^ "Councillor Chris Blakeley". Wirral Metropolitan Borough Council. Archived from the original on 1 September 2020. Retrieved 17 July 2018.
- ^ "Election results for New Brighton". Wirral Metropolitan Borough Council.
- ^ "Councillor Tony Jones". Wirral Metropolitan Borough Council.
- ^ "Councillor Tony Pritchard". Wirral Metropolitan Borough Council. Archived from the original on 12 June 2018. Retrieved 17 July 2018.
- ^ "Election results for Oxton". Wirral Metropolitan Borough Council.
- ^ "Councillor Stuart Kelly". Wirral Metropolitan Borough Council.
- ^ "Election results for Pensby and Thingwall". Wirral Metropolitan Borough Council.
- ^ "Councillor Michael Sullivan". Wirral Metropolitan Borough Council. Archived from the original on 12 July 2018. Retrieved 17 July 2018.
- ^ "Councillor Andrew Gardner". Wirral Metropolitan Borough Council.
- ^ "Election results for Prenton". Wirral Metropolitan Borough Council.
- ^ "Councillor Tony Norbury". Wirral Metropolitan Borough Council.
- ^ "Councillor Allan Brame". Wirral Metropolitan Borough Council.
- ^ "Councillor Christopher Cooke". Wirral Metropolitan Borough Council. Retrieved 8 May 2019.
- ^ "Election results for Rock Ferry". Wirral Metropolitan Borough Council.
- ^ "Councillor Bill Daives". Wirral Metropolitan Borough Council. Archived from the original on 12 June 2018. Retrieved 17 July 2018.
- ^ "Election results for Seacombe". Wirral Metropolitan Borough Council.
- ^ "Councillor Paul Stuart". Wirral Metropolitan Borough Council.
- ^ "Election results for Upton". Wirral Metropolitan Borough Council.
- ^ "Councillor Matthew Patrick". Wirral Metropolitan Borough Council.
- ^ "Election results for Wallasey". Wirral Metropolitan Borough Council.
- ^ "Councillor Ian Lewis". Wirral Metropolitan Borough Council.
- ^ "Election results for West Kirby and Thurstaston". Wirral Metropolitan Borough Council.
- ^ "Councillor Geoffrey Watt". Wirral Metropolitan Borough Council. Archived from the original on 12 June 2018. Retrieved 17 July 2018.
- ^ "Election results for Claughton". Wirral Metropolitan Borough Council.
- ^ "Councillor Gillian Wood". Wirral Metropolitan Borough Council.