2016 Stroud District Council election
| |||||||||||||||||||||||||||||||||||||||||||||||||||||
All 51 seats to Stroud District Council 26 seats needed for a majority | |||||||||||||||||||||||||||||||||||||||||||||||||||||
|---|---|---|---|---|---|---|---|---|---|---|---|---|---|---|---|---|---|---|---|---|---|---|---|---|---|---|---|---|---|---|---|---|---|---|---|---|---|---|---|---|---|---|---|---|---|---|---|---|---|---|---|---|---|
| |||||||||||||||||||||||||||||||||||||||||||||||||||||
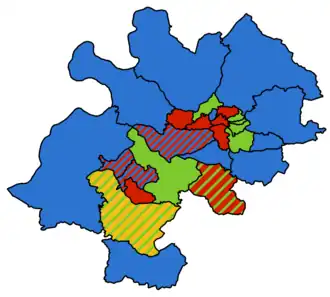 2016 local election results in Stroud | |||||||||||||||||||||||||||||||||||||||||||||||||||||
| |||||||||||||||||||||||||||||||||||||||||||||||||||||
The 2016 Stroud District Council election took place on 5 May 2016 to elect members of Stroud District Council in England.[1] This was on the same day as other local elections. Due to boundary changes, all seats were up for election, with the council moving to a four-year election cycle.[2]
Results summary
| Stroud District Council election, 2016[3] | ||||||||||
|---|---|---|---|---|---|---|---|---|---|---|
| Party | Candidates | Seats | Gains | Losses | Net gain/loss | Seats % | Votes % | Votes | +/− | |
| Conservative | 23 | 45.1 | 30.8 | 14,274 | ||||||
| Labour | 18 | 35.3 | 28.3 | 13,079 | ||||||
| Green | 8 | 15.7 | 23.7 | 10,946 | ||||||
| Liberal Democrats | 2 | 3.9 | 8.8 | 4,080 | ||||||
| Independent | 0 | 0.0 | 5.7 | 2,625 | ||||||
| UKIP | 0 | 0.0 | 2.5 | 1,151 | ||||||
| TUSC | 0 | 0 | 0.3 | 120 | ||||||
A total of 181 ballots were rejected, and the overall turnout was 42.59%.
Ward results
Amberley & Woodchester
| Party | Candidate | Votes | % | ±% | |
|---|---|---|---|---|---|
| Conservative | Philip Louis McAsey | 366 | 45.7 | ||
| Labour | Jo Smith | 297 | 37.1 | ||
| Green | Martyn George Cutcher | 138 | 17.2 | ||
| Majority | 69 | 8.6 | |||
| Turnout | 806 | 47.3 | |||
| Rejected ballots | 5 | 0.6 | |||
| Conservative win | |||||
Berkeley Vale
| Party | Candidate | Votes | % | ±% | |
|---|---|---|---|---|---|
| Conservative | Gordon Alexander Stark Craig* | 1,279 | 52.2 | ||
| Conservative | Penny Wride* | 1,172 | 47.8 | ||
| Conservative | Haydn Jones | 1,050 | 42.9 | ||
| Labour | Liz Ashton* | 951 | 38.8 | ||
| Labour | Billy Hunt | 672 | 27.4 | ||
| Labour | George Frederick Coleman Knight | 646 | 26.4 | ||
| Liberal Democrats | Michael Robert Stayte | 370 | 15.1 | ||
| Liberal Democrats | Nick Easby | 317 | 12.9 | ||
| Liberal Democrats | Rob Jewell | 234 | 9.6 | ||
| Green | Tom Willetts | 227 | 9.3 | ||
| Majority | 99 | 4.1 | |||
| Turnout | 2,456 | 44.3 | |||
| Rejected ballots | 6 | 0.2 | |||
| Conservative win | |||||
| Conservative win | |||||
| Conservative win | |||||
Bisley
| Party | Candidate | Votes | % | ±% | |
|---|---|---|---|---|---|
| Conservative | Tim Williams* | 515 | 57.2 | ||
| Green | Anna Elizabeth Bonallack | 280 | 31.1 | ||
| Labour | Richard Alan House | 105 | 11.7 | ||
| Majority | 235 | 26.1 | |||
| Turnout | 902 | 48.7 | |||
| Rejected ballots | 2 | 0.2 | |||
| Conservative win | |||||
Cainscross
| Party | Candidate | Votes | % | ±% | |
|---|---|---|---|---|---|
| Labour | Rachel Curley | 924 | 43.8 | ||
| Labour | Jenny Miles | 903 | 42.8 | ||
| Labour | Tom Williams* | 775 | 36.7 | ||
| Independent | David Mark Rees* | 616 | 29.2 | ||
| Green | Patricia Helen Royall | 498 | 23.6 | ||
| Conservative | Keith Stuart Rippington | 487 | 23.1 | ||
| Conservative | Colin Chrisholm | 405 | 19.2 | ||
| Conservative | Anthony Richard Powell | 405 | 19.2 | ||
| Independent | Graham Keith Stanley | 348 | 16.5 | ||
| Liberal Democrats | Sylvia Jean Bridgland | 297 | 14.1 | ||
| TUSC | Chris Moore | 52 | 2.5 | ||
| TUSC | Adam Mark Goulcher | 32 | 1.5 | ||
| TUSC | Ray Darlington | 30 | 1.4 | ||
| Majority | 159 | 7.5 | |||
| Turnout | 2,116 | 35.9 | |||
| Rejected ballots | 5 | 0.2 | |||
| Labour win | |||||
| Labour win | |||||
| Labour win | |||||
Cam East
| Party | Candidate | Votes | % | ±% | |
|---|---|---|---|---|---|
| Labour | Miranda Anne Clifton* | 742 | 51.2 | ||
| Conservative | Brian Tipper* | 707 | 48.8 | ||
| Conservative | Graham Blackshaw | 546 | 37.7 | ||
| Labour | James Kenneth Martin Prewett | 533 | 36.8 | ||
| Green | Steven Naumann | 175 | 12.1 | ||
| Majority | 161 | 11.1 | |||
| Turnout | 1,458 | 40.3 | |||
| Rejected ballots | 8 | 0.5 | |||
| Labour win | |||||
| Conservative win | |||||
Cam West
| Party | Candidate | Votes | % | ±% | |
|---|---|---|---|---|---|
| Labour | Paul Anthony Denney* | 566 | 48.1 | ||
| Conservative | Jessica Mary Olivia Tomblin | 518 | 44.0 | ||
| Labour | Julie Alyson Douglass* | 517 | 44.0 | ||
| Conservative | Neil Edward Fletcher | 487 | 41.4 | ||
| Green | Neil Richards Buick | 153 | 13.0 | ||
| Majority | 1 | 0.0 | |||
| Turnout | 1,182 | 38.8 | |||
| Rejected ballots | 6 | 0.5 | |||
| Labour win | |||||
| Conservative win | |||||
Chalford
| Party | Candidate | Votes | % | ±% | |
|---|---|---|---|---|---|
| Conservative | Liz Peters* | 930 | 43.7 | ||
| Conservative | Chas Fellows* | 927 | 43.6 | ||
| Conservative | Debbie Young* | 905 | 42.5 | ||
| Green | Carolyn Jane Billingsley | 810 | 38.1 | ||
| Labour | Helen Joan Beioley | 799 | 37.6 | ||
| Labour | David Arthur Taylor | 738 | 34.7 | ||
| UKIP | Adrian George Blake | 353 | 16.6 | ||
| Majority | 95 | 4.4 | |||
| Turnout | 2,130 | 42.2 | |||
| Rejected ballots | 3 | 0.1 | |||
| Conservative win | |||||
| Conservative win | |||||
| Conservative win | |||||
Coaley & Uley
| Party | Candidate | Votes | % | ±% | |
|---|---|---|---|---|---|
| Green | Jim Dewey | 532 | 52.9 | ||
| Conservative | Tim Boxall* | 350 | 34.8 | ||
| Labour | Brendan Skelton | 124 | 12.3 | ||
| Majority | 182 | 18.1 | |||
| Turnout | 1,012 | 52.8 | |||
| Rejected ballots | 6 | 0.6 | |||
| Green win | |||||
Dursley
| Party | Candidate | Votes | % | ±% | |
|---|---|---|---|---|---|
| Labour | Doina Claire Cornell* | 932 | 48.3 | ||
| Labour | Colin Patrick Fryer* | 851 | 44.1 | ||
| Labour | Alison Margaret Hayward | 757 | 39.3 | ||
| Conservative | Loraine Vivienne Patrick | 623 | 32.3 | ||
| Liberal Democrats | Brian Arthur Marsh | 606 | 31.4 | ||
| Conservative | Andrea Elizabeth Sheffield | 583 | 30.2 | ||
| Conservative | Patricia Ann Betteley | 565 | 29.3 | ||
| Green | Miriam Janice Yagud | 359 | 18.6 | ||
| Majority | 134 | 7.0 | |||
| Turnout | 1,936 | 37.0 | |||
| Rejected ballots | 8 | 0.4 | |||
| Labour win | |||||
| Labour win | |||||
| Labour win | |||||
Hardwicke
| Party | Candidate | Votes | % | ±% | |
|---|---|---|---|---|---|
| Conservative | Dave Mossman* | 902 | 56.1 | ||
| Conservative | Gill Oxley | 883 | 54.9 | ||
| Conservative | Tom Skinner | 666 | 41.4 | ||
| Independent | Gerald Owain Hartley | 614 | 38.2 | ||
| Green | Sally Pickering | 447 | 27.8 | ||
| Labour | Steve Price | 439 | 27.3 | ||
| Majority | 52 | 3.2 | |||
| Turnout | 1,613 | 30.6 | |||
| Rejected ballots | 6 | 0.4 | |||
| Conservative win | |||||
| Conservative win | |||||
| Conservative win | |||||
Kingswood
| Party | Candidate | Votes | % | ±% | |
|---|---|---|---|---|---|
| Conservative | Richard Mark Reeves | 335 | 48.3 | ||
| Liberal Democrats | Oliver Hartland Mountjoy | 283 | 40.8 | ||
| Green | Alan Graham Sage | 76 | 11.0 | ||
| Majority | 52 | 7.5 | |||
| Turnout | 701 | 41.1 | |||
| Rejected ballots | 6 | 0.9 | |||
| Conservative win | |||||
Minchinhampton
| Party | Candidate | Votes | % | ±% | |
|---|---|---|---|---|---|
| Conservative | Dorcas Lavinia Maxine Binns* | 844 | 55.2 | ||
| Conservative | Nick Hurst* | 760 | 49.7 | ||
| Labour | Mark Christopher Huband | 339 | 22.2 | ||
| Green | Chris Jockel | 309 | 20.2 | ||
| Liberal Democrats | Colleen Rothwell | 264 | 17.3 | ||
| Liberal Democrats | Jean Marie Etridge | 240 | 15.7 | ||
| TUSC | Ruth Amias | 68 | 4.4 | ||
| Majority | 421 | 27.5 | |||
| Turnout | 1,535 | 42.3 | |||
| Rejected ballots | 5 | 0.3 | |||
| Conservative win | |||||
| Conservative win | |||||
Nailsworth
| Party | Candidate | Votes | % | ±% | |
|---|---|---|---|---|---|
| Labour | Steve Robinson* | 1,455 | 62.1 | ||
| Labour | Sue Reed | 1,358 | 58.0 | ||
| Green | Norman Kay | 1,185 | 50.6 | ||
| Conservative | Emma Sims* | 899 | 38.4 | ||
| Conservative | Charles Edward O’Neill | 685 | 29.2 | ||
| Conservative | Ryan Davis | 606 | 25.9 | ||
| Majority | 286 | 12.2 | |||
| Turnout | 2,356 | 44.6 | |||
| Rejected ballots | 14 | 0.6 | |||
| Labour win | |||||
| Labour win | |||||
| Green win | |||||
Painswick & Upton
| Party | Candidate | Votes | % | ±% | |
|---|---|---|---|---|---|
| Conservative | Nigel Robin Cooper* | 1,350 | 56.8 | ||
| Conservative | Julie Anthea Job* | 1,350 | 56.8 | ||
| Conservative | Keith Lionel Pearson* | 1,224 | 51.5 | ||
| Green | Peter Adams | 809 | 34.0 | ||
| Labour | Sarah Ruth Madley | 680 | 28.6 | ||
| UKIP | Richard Ford | 397 | 16.7 | ||
| Majority | 415 | 17.5 | |||
| Turnout | 2,384 | 42.3 | |||
| Rejected ballots | 7 | 0.3 | |||
| Conservative win | |||||
| Conservative win | |||||
| Conservative win | |||||
Randwick, Whiteshill & Ruscombe
| Party | Candidate | Votes | % | ±% | |
|---|---|---|---|---|---|
| Green | Jonathan Paul Edmunds* | 489 | 59.4 | ||
| Conservative | Tom Cooper | 184 | 22.4 | ||
| Labour | John Bloxson | 150 | 18.2 | ||
| Majority | 305 | 37.0 | |||
| Turnout | 829 | 47.6 | |||
| Rejected ballots | 6 | 0.72 | |||
| Green win | |||||
Rodborough
| Party | Candidate | Votes | % | ±% | |
|---|---|---|---|---|---|
| Labour | Nigel Andrew Prenter* | 693 | 44.7 | ||
| Labour | Karen Helen McKeown | 656 | 42.3 | ||
| Conservative | Libby Bird | 435 | 28.0 | ||
| Green | Philip Sven Blomberg | 335 | 21.6 | ||
| Conservative | Sarah Leslie Shaw | 304 | 19.6 | ||
| Liberal Democrats | Christine Linda Headley | 285 | 18.4 | ||
| Green | Kiera Megan Jones | 207 | 13.3 | ||
| Majority | 221 | 14.3 | |||
| Turnout | 1,557 | 43.4 | |||
| Rejected ballots | 5 | 0.3 | |||
| Labour win | |||||
| Labour win | |||||
Severn
| Party | Candidate | Votes | % | ±% | |
|---|---|---|---|---|---|
| Conservative | John Frederick Jones* | 723 | 49.9 | ||
| Conservative | Stephen Frank Davies* | 721 | 49.8 | ||
| Labour | Thomas Joseph Lydon | 446 | 30.8 | ||
| Liberal Democrats | John Reginald Howe | 353 | 24.4 | ||
| Green | Robin Lewis | 291 | 20.1 | ||
| Majority | 275 | 19.0 | |||
| Turnout | 1,463 | 36.9 | |||
| Rejected ballots | 14 | 1.0 | |||
| Conservative win | |||||
| Conservative win | |||||
Stonehouse
| Party | Candidate | Votes | % | ±% | |
|---|---|---|---|---|---|
| Labour | Chris Brine* | 1,102 | 55.9 | ||
| Labour | Mattie Ross* | 1,058 | 53.6 | ||
| Labour | Gary Dean Powell* | 1,039 | 52.7 | ||
| Conservative | Ray Clegg | 466 | 23.6 | ||
| Conservative | Ginny Anne Smart | 430 | 21.8 | ||
| Green | Carol Jill Kambites | 363 | 18.4 | ||
| Conservative | Aaron James Newell | 345 | 17.5 | ||
| Independent | Trevor Royston Baker | 306 | 15.5 | ||
| Independent | Ciaran James Brazington | 296 | 15.0 | ||
| Majority | 573 | 29.1 | |||
| Turnout | 1,982 | 34.7 | |||
| Rejected ballots | 9 | 0.5 | |||
| Labour win | |||||
| Labour win | |||||
| Labour win | |||||
Stroud Central
| Party | Candidate | Votes | % | ±% | |
|---|---|---|---|---|---|
| Labour | Skeena Rathor | 275 | 39.4 | ||
| Green | Caroline Baird | 268 | 38.4 | ||
| Conservative | Marcus William Shaw | 154 | 22.1 | ||
| Majority | 7 | 1.0 | |||
| Turnout | 708 | 42.7 | |||
| Rejected ballots | 11 | 1.6 | |||
| Labour win | |||||
Stroud Farmhill & Paganhill
| Party | Candidate | Votes | % | ±% | |
|---|---|---|---|---|---|
| Conservative | Haydn Leonard Sutton* | 300 | 39.8 | ||
| Labour | Paul Mapplebeck | 208 | 27.6 | ||
| Independent | Harry Carr | 132 | 17.5 | ||
| Green | Brian Nimblette | 113 | 15.0 | ||
| Majority | 92 | 12.2 | |||
| Turnout | 759 | 40.6 | |||
| Rejected ballots | 4 | 0.5 | |||
| Conservative win | |||||
Stroud Slade
| Party | Candidate | Votes | % | ±% | |
|---|---|---|---|---|---|
| Green | Simon Paul Christopher Pickering* | 363 | 51.6 | ||
| Labour | Vanessa Price | 260 | 37.0 | ||
| Conservative | Kris Anthony Smith | 80 | 11.4 | ||
| Majority | 103 | 14.6 | |||
| Turnout | 707 | 41.3 | |||
| Rejected ballots | 4 | 0.6 | |||
| Green win | |||||
Stroud Trinity
| Party | Candidate | Votes | % | ±% | |
|---|---|---|---|---|---|
| Green | John Marjoram* | 489 | 61.1 | ||
| Labour | Roy Derbyshire | 199 | 24.9 | ||
| Conservative | Ian Arthur Edmunds | 112 | 14.0 | ||
| Majority | 290 | 36.2 | |||
| Turnout | 807 | 47.4 | |||
| Rejected ballots | 7 | 0.9 | |||
| Green win | |||||
Stroud Uplands
| Party | Candidate | Votes | % | ±% | |
|---|---|---|---|---|---|
| Labour | Chas Townley* | 319 | 42.9 | ||
| Independent | Roger Sanders | 235 | 31.6 | ||
| Green | Peter Richardson | 110 | 14.8 | ||
| Conservative | Jeremy Norman Bennett Strickland | 79 | 10.6 | ||
| Majority | 84 | 11.3 | |||
| Turnout | 749 | 44.8 | |||
| Rejected ballots | 6 | 0.8 | |||
| Labour win | |||||
Stroud Valley
| Party | Candidate | Votes | % | ±% | |
|---|---|---|---|---|---|
| Green | Martin Baxendale* | 394 | 54.5 | ||
| Labour | Joe Ambridge | 234 | 32.4 | ||
| Conservative | John Stanton | 95 | 13.1 | ||
| Majority | 160 | 22.1 | |||
| Turnout | 728 | 42.5 | |||
| Rejected ballots | 4 | 0.5 | |||
| Green win | |||||
The Stanleys
| Party | Candidate | Votes | % | ±% | |
|---|---|---|---|---|---|
| Labour | Stephen Leslie Lydon* | 740 | 50.5 | ||
| Conservative | Nigel William John Studdert-Kennedy* | 617 | 42.1 | ||
| Labour | Debbie Tara Hicks | 540 | 36.9 | ||
| Conservative | Lawrie Hall | 534 | 36.5 | ||
| Green | Nicola Caryl Hillary | 283 | 19.3 | ||
| Majority | 77 | 5.2 | |||
| Turnout | 1,479 | 44.3 | |||
| Rejected ballots | 15 | 1.0 | |||
| Labour win | |||||
| Conservative win | |||||
Thrupp
| Party | Candidate | Votes | % | ±% | |
|---|---|---|---|---|---|
| Green | Martin Whiteside* | 620 | 69.7 | ||
| Conservative | Steve Wigzell | 170 | 19.1 | ||
| Labour | Rod Beer | 100 | 11.2 | ||
| Majority | 450 | 50.6 | |||
| Turnout | 896 | 48.2 | |||
| Rejected ballots | 4 | 0.4 | |||
| Green win | |||||
Wotton-under-Edge
| Party | Candidate | Votes | % | ±% | |
|---|---|---|---|---|---|
| Liberal Democrats | Ken Tucker* | 1,622 | 63.5 | ||
| Green | Catherine Braun | 830 | 32.5 | ||
| Liberal Democrats | George Butcher | 804 | 31.5 | ||
| Conservative | Lesley Reeves* | 754 | 29.5 | ||
| Liberal Democrats | Adrian Walker-Smith | 745 | 29.2 | ||
| Independent | Alex Wilkinson | 722 | 28.3 | ||
| Conservative | Henry Binns | 480 | 18.8 | ||
| Conservative | Alexander Wheeler | 419 | 16.4 | ||
| UKIP | Henry David Hinder | 401 | 15.7 | ||
| Majority | 50 | 2.0 | |||
| Turnout | 2,558 | 47.2 | |||
| Rejected ballots | 5 | 0.2 | |||
| Liberal Democrats win | |||||
| Green win | |||||
| Liberal Democrats win | |||||
References
- ^ "District Council Statement of Persons Nominated". Stroud District Council. Archived from the original on 26 April 2016. Retrieved 20 April 2016.
- ^ "District and Parish/Town Council elections". Stroud District Council. Archived from the original on 26 April 2016. Retrieved 20 April 2016.
- ^ "Local Election Results 2016 - Stroud". 21 May 2025. Retrieved 21 May 2025.
| Gloucestershire County Council | |||||||||
|---|---|---|---|---|---|---|---|---|---|
| Cheltenham Borough Council | |||||||||
| Cotswold District Council | |||||||||
| Forest of Dean District Council | |||||||||
| Gloucester City Council | |||||||||
| South Gloucestershire Council | |||||||||
| Stroud District Council | |||||||||
| Tewkesbury Borough Council | |||||||||
| West of England Mayor | |||||||||
| |||||||||
| |||||||||