2017 Dundee City Council election|
|
|
| Turnout | 39.6% |
|---|
|
|
First party
|
Second party
|
Third party
|
|
|
|
|
|
| Leader
|
John Alexander
|
Kevin Keenan
|
Derek Scott
|
| Party
|
SNP
|
Labour
|
Conservative
|
| Leader's seat
|
Strathmartine
|
Strathmartine
|
The Ferry
|
| Last election
|
16 seats, 43.4%
|
10 seats, 30.1%
|
1 seat, 11.3%
|
| Seats won
|
14
|
9
|
3
|
| Seat change
|
 2 2
|
1
|
 2 2
|
| Popular vote
|
18,289
|
8,997
|
7,644
|
| Percentage
|
41.3%
|
20.3%
|
17.2%
|
| Swing
|
2.1%
|
9.8%
|
5.9%
|
|
|
|
Fourth party
|
Fifth party
|
|
|
|
|
| Leader
|
Fraser Macpherson
|
Ian Borthwick
|
| Party
|
Liberal Democrats
|
Independent
|
| Leader's seat
|
West End
|
Strathmartine
|
| Last election
|
1 seat, 9.0%
|
1 seat, 4.4%
|
| Seats won
|
2
|
1
|
| Seat change
|
1
|

|
| Popular vote
|
5,011
|
2,364
|
| Percentage
|
11.3%
|
5.3%
|
| Swing
|
2.3%
|
0.9%
|
|
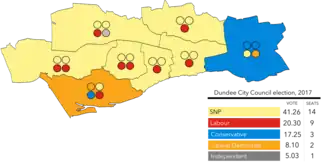 The eight multi-member wards; colours denote the winning party, as shown in the main table of results. |
 |
|
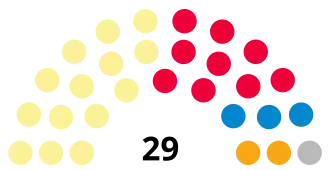
Elections to Dundee City Council were held on 4 May 2017 on the same day as the other Scottish local government elections. The election used the eight wards created as a result of the Local Governance (Scotland) Act 2004, with each ward electing three or four Councillors using the single transferable vote system (a form of proportional representation). A total of 29 Councillors were elected.
After the 2012 election a Scottish National Party (SNP) majority administration of 16 was formed. In 2017 the SNP lost 2 seats reducing their numbers to 14, being one seat short of an overall majority. They formed an administration with the support of the Independent Ian Borthwick.[1]
Background
Previous election
At the previous election in 2012 the SNP took 16 seats and was able to form a majority administration. Labour were second with 10 and the remaining groups had 1 seat each.
Source:[2]
Composition
Throughout the term of the previous council, there was minimal change in the composition of members. In January 2016, Craig Melville, who was an SNP councillor for Maryfield was suspended from the party, thereby taking the number of councillors the SNP had to 15. Melville later resigned as a councillor and a by-election took place which was won back by the SNP thus resulting in the SNP returning back to 16 seats for the remainder of the term.
Retiring councillors
Ahead of the election, seven councillors announced their retirement and would not stand for re-election, that included Bob Duncan who was Lord Provost and the council leader, Ken Guild.
Results
Note: "Votes" are the first preference votes. The net gain/loss and percentage changes relate to the result of the previous Scottish local elections on 3 May 2012. This may differ from other published sources showing gain/loss relative to seats held at dissolution of Scotland's councils.
Votes summary
↓
| 14
|
9
|
3
|
2
|
1
|
| SNP
|
Labour
|
Conservative
|
LD
|
Independent
|
| First preference vote share |
|---|
|
|
|
| SNP |
|
41.3% |
| Labour |
|
21.0% |
| Conservative |
|
17.2% |
| Liberal Democrats |
|
11.3% |
| Independent |
|
5.3% |
| Green |
|
2.5% |
| Other |
|
2.0% |
|
| Council seats |
|---|
|
|
|
| SNP |
|
48.3% |
| Labour |
|
31.0% |
| Conservative |
|
10.3% |
| Liberal Democrats |
|
6.9% |
| Independent |
|
3.5% |
|
Ward summary
Results of the 2017 Dundee City Council election by ward
| Ward
|
%
|
Seats
|
%
|
Seats
|
%
|
Seats
|
%
|
Seats
|
%
|
Seats
|
%
|
Seats
|
Total
|
| SNP
|
Lab
|
Conservative
|
Lib Dems
|
Independent
|
Others
|
| Strathmartine
|
43.2%
|
2
|
18.9%
|
1
|
9.0%
|
0
|
13.6%
|
0
|
13.5%
|
1
|
1.7%
|
0
|
4
|
| Lochee
|
42.7%
|
2
|
29.3%
|
2
|
12.1%
|
0
|
2.1%
|
0
|
9.7%
|
0
|
4.1%
|
0
|
4
|
| West End
|
28.6%
|
1
|
11.6%
|
1
|
11.8%
|
1
|
38.5%
|
1
|
2.4%
|
0
|
9.6%
|
0
|
4
|
| Coldside
|
44.2%
|
2
|
27.9%
|
2
|
11.0%
|
0
|
2.8%
|
0
|
8.6%
|
0
|
5.6%
|
0
|
4
|
| Maryfield
|
49.4%
|
2
|
21.6%
|
1
|
17.6%
|
0
|
5.3%
|
0
|
|
|
6.1%
|
0
|
3
|
| North East
|
53.7%
|
2
|
27.0%
|
1
|
9.1%
|
0
|
1.3%
|
0
|
5.8%
|
0
|
3.0%
|
0
|
3
|
| East End
|
53.3%
|
2
|
21.7%
|
1
|
12.9%
|
0
|
2.5%
|
0
|
4.6%
|
0
|
5.0%
|
0
|
3
|
| The Ferry
|
29.9%
|
1
|
11.7%
|
0
|
38.9%
|
2
|
15.8%
|
1
|
|
|
3.6%
|
0
|
4
|
| Total
|
41.3%
|
14
|
20.3%
|
9
|
17.3%
|
3
|
11.3%
|
2
|
5.3%
|
1
|
4.6%
|
0
|
29
|
Ward results
Strathmartine
- 2012: 2xSNP; 1xLab; 1xIndependent
- 2017: 2xSNP; 1xLab; 1xIndependent
- 2012-2017 Change: No Change
Strathmartine - 4 seats
| Party |
Candidate |
FPv% |
Count
|
| 1 |
2 |
3 |
4 |
5 |
6 |
7
|
|
|
SNP
|
John Alexander (incumbent)
|
32.1%
|
1,956
|
|
|
|
|
|
|
|
|
Labour
|
Kevin Keenan (incumbent)
|
18.9%
|
1,155
|
1,178.7
|
1,182.9
|
1,220.9
|
|
|
|
|
|
Liberal Democrats
|
Daniel Coleman
|
13.6%
|
828
|
866
|
869.5
|
884.5
|
884.8
|
1,076.9
|
|
|
|
Independent
|
Ian Borthwick (incumbent)
|
13.5%
|
825
|
876.5
|
883.3
|
911.9
|
912.2
|
1,085.4
|
1,641.1
|
|
|
SNP
|
Stewart Hunter (incumbent)
|
11.2%
|
680
|
1,250.05
|
|
|
|
|
|
|
|
Conservative
|
Robert Lindsay
|
9.0%
|
546
|
549.8
|
550.1
|
555.2
|
555.3
|
|
|
|
|
TUSC
|
Sinead Daly
|
1.7%
|
105
|
115.2
|
118.7
|
|
|
|
|
| Electorate: 15,017 Valid: 6,095 Spoilt: 139 Quota: 1,220 Turnout: 6,234 (41.5%)
|
Lochee
- 2012: 2xSNP; 1xLab; 1x independent
- 2017: 2xSNP; 2xLab
- 2012-2017: Labour Gain from independent
Lochee - 4 seats
| Party |
Candidate |
FPv% |
Count
|
| 1 |
2 |
3 |
4 |
5 |
6 |
7 |
8 |
9 |
10
|
|
|
SNP
|
Alan Ross (incumbent)
|
28.6%
|
1,661
|
|
|
|
|
|
|
|
|
|
|
|
Labour
|
Charlie Malone
|
15.9%
|
924
|
933.3
|
940.3
|
943.7
|
959.9
|
993.4
|
1,020.9
|
1,217.7
|
|
|
|
|
SNP
|
Roisin Smith
|
14.1%
|
818
|
1,256.9
|
|
|
|
|
|
|
|
|
|
|
Labour
|
Michael Marra
|
13.4%
|
778
|
785.5
|
793.2
|
794.5
|
812.8
|
819.4
|
848.4
|
968.5
|
1,012.5
|
1,241.8
|
|
|
Conservative
|
Mason Mcilreavy
|
12.1%
|
700
|
702.4
|
703.9
|
708.2
|
724.5
|
728.5
|
739.2
|
813.2
|
814.9
|
|
|
|
Independent
|
Tom Ferguson (incumbent)
|
9.7%
|
565
|
574.3
|
582.4
|
584.4
|
597.5
|
623.6
|
673.4
|
|
|
|
|
|
Scottish Green
|
Gordon Matheson
|
2.3%
|
132
|
137.4
|
163.6
|
166.2
|
185.8
|
206.5
|
|
|
|
|
|
|
TUSC
|
Leah Ganley
|
1.8%
|
102
|
104.1
|
108.06
|
110.06
|
112.2
|
|
|
|
|
|
|
|
Liberal Democrats
|
Lynn Hutchison
|
1.6%
|
91
|
91.6
|
92.2
|
106.5
|
|
|
|
|
|
|
|
|
Liberal Democrats
|
Kirsty McKenzie
|
0.5%
|
31
|
32.5
|
35.1
|
|
|
|
|
|
|
|
| Electorate: 14,276 Valid: 5,802 Spoilt: 163 Quota: 1,161 Turnout: 5,965 (41.8%)
|
West End
- 2012: 2xSNP; 1xLib Dem; 1xLab
- 2017: 1xLib Dem; 1xSNP; 1xCon; 1xLab
- 2012-2017: Conservative gain one seat from SNP
West End - 4 seats
| Party |
Candidate |
FPv% |
Count
|
| 1 |
2 |
3 |
4 |
5 |
6 |
7 |
8
|
|
|
Liberal Democrats
|
Fraser MacPherson (incumbent)
|
38.5%
|
2,105
|
|
|
|
|
|
|
|
|
|
SNP
|
Bill Campbell (incumbent)
|
19.9%
|
1,090
|
1,210.9
|
|
|
|
|
|
|
|
|
Conservative
|
Donald Hay
|
11.8%
|
643
|
887.2
|
888.5
|
889.5
|
901.3
|
929.8
|
958.6
|
987.2
|
|
|
Labour
|
Richard McCready (incumbent)
|
11.6%
|
637
|
876.9
|
883.6
|
889.2
|
904.04
|
932.9
|
1,078.6
|
1,416.7
|
|
|
SNP
|
Steven Rome
|
8.7%
|
474
|
506.6
|
597.5
|
611.1
|
623.5
|
637.1
|
838.8
|
|
|
|
Scottish Green
|
Morgan Petrie
|
6.1%
|
331
|
432.2
|
439.5
|
472.7
|
495.1
|
515.9
|
|
|
|
|
Independent
|
Andrew McBride
|
1.2%
|
67
|
118.3
|
119.6
|
123.09
|
136.9
|
|
|
|
|
|
Independent
|
Bradley Booth
|
1.2%
|
65
|
93.8
|
95.1
|
96.7
|
|
|
|
|
|
|
Scottish Socialist
|
Tam Wilson
|
1.1%
|
59
|
66.2
|
66.9
|
|
|
|
|
|
| Electorate: 12,959 Valid: 5,471 Spoilt: 67 Quota: 1,095 Turnout: 5,538 (42.7%)
|
Coldside
- 2012: 2xSNP; 2xLab
- 2017: 2xSNP; 2xLab
- 2012-2017: No Change
Coldside - 4 seats
| Party |
Candidate |
FPv% |
Count
|
| 1 |
2 |
3 |
4 |
5 |
6 |
7 |
8 |
9 |
10
|
|
|
SNP
|
Mark Flynn
|
27.7%
|
1,560
|
|
|
|
|
|
|
|
|
|
|
|
Labour
|
George McIrvine
|
16.6%
|
933
|
951.4
|
959.5
|
965.4
|
974.7
|
996.08
|
1,059.9
|
1,223.9
|
|
|
|
|
SNP
|
Anne Rendall
|
16.5%
|
925
|
1,252.9
|
|
|
|
|
|
|
|
|
|
|
Labour
|
Helen Wright (incumbent)
|
11.3%
|
633
|
638.02
|
647.9
|
650.5
|
664.04
|
677.9
|
725.9
|
843.7
|
908.9
|
1,139.8
|
|
|
Conservative
|
Duncan Shaw
|
11.0%
|
618
|
621.07
|
622.1
|
625.4
|
628.4
|
657.5
|
663.9
|
709.8
|
715.1
|
|
|
|
Independent
|
Mohammed Asif (incumbent)
|
8.6%
|
481
|
495.2
|
504.07
|
505.1
|
510.3
|
529.2
|
615.8
|
|
|
|
|
|
Scottish Green
|
Conor Marshall
|
4.1%
|
232
|
252.4
|
291.6
|
295.2
|
327.9
|
351.1
|
|
|
|
|
|
|
Liberal Democrats
|
Kristopher Hall
|
1.8%
|
101
|
106.02
|
108.8
|
139.1
|
141.2
|
|
|
|
|
|
|
|
TUSC
|
Wayne Scott
|
1.5%
|
82
|
84.8
|
90.7
|
93.9
|
|
|
|
|
|
|
|
|
Liberal Democrats
|
Christopher McIntyre
|
1.0%
|
57
|
60.9
|
62.3
|
|
|
|
|
|
|
|
| Electorate: 14,262 Valid: 5,622 Spoilt: 229 Quota: 1,125 Turnout: 5,851 (41%)
|
Maryfield
- 2012: 2xSNP; 1xLab
- 2017: 2xSNP; 1xLab
- 2012-2017: No change
Maryfield - 3 seats
| Party |
Candidate |
FPv% |
Count
|
| 1 |
2 |
3 |
4 |
5
|
|
|
SNP
|
Ken Lynn (incumbent)
|
30.3%
|
1,240
|
|
|
|
|
|
|
Labour
|
Georgia Cruickshank (incumbent)
|
21.6%
|
885
|
894.8
|
902.9
|
968.3
|
1,051.9
|
|
|
SNP
|
Lynne Short (incumbent)
|
19.1%
|
782
|
968.2
|
972.9
|
997.4
|
1,084.3
|
|
|
Conservative
|
James Clancy
|
17.6%
|
722
|
722.8
|
726.9
|
775.9
|
792.9
|
|
|
TUSC
|
Stuart Fairweather
|
6.1%
|
250
|
253.3
|
253.5
|
270.8
|
|
|
|
Liberal Democrats
|
Jenny Blain
|
4.1%
|
168
|
169.2
|
194.7
|
|
|
|
|
Liberal Democrats
|
Robbie McKaig
|
1.2%
|
48
|
49.6
|
|
|
|
| Electorate: 12,021 Valid: 4,095 Spoilt: 89 Quota: 1,024 Turnout: 4,184 (34.8%)
|
North East
- 2012: 2xSNP; 1xLab
- 2017: 2xSNP; 1xLab
- 2012-2017: No Change
East End
- 2012: 2xSNP; 1xLab
- 2017: 2xSNP; 1xLab
- 2012-2017: No Change
East End - 3 seats
| Party |
Candidate |
FPv% |
Count
|
| 1 |
2 |
3 |
4 |
5 |
6 |
7 |
8
|
|
|
SNP
|
Will Dawson (incumbent)
|
38.6%
|
1,553
|
|
|
|
|
|
|
|
|
|
Labour
|
Margaret Richardson
|
24%
|
965
|
982.7
|
986.5
|
993.5
|
1,004.1
|
1,047.1
|
1,089.7
|
1,177.9
|
|
|
SNP
|
Christina Roberts (incumbent)
|
20.2%
|
811
|
1,144.2
|
|
|
|
|
|
|
|
|
Conservative
|
Darren Kane
|
14.2%
|
571
|
575.6
|
576.2
|
585.5
|
589.5
|
619.7
|
630.3
|
677.2
|
|
|
Independent
|
Darryl Guthrie
|
5.1%
|
205
|
217.3
|
219.2
|
225.3
|
237.3
|
252.6
|
303.5
|
|
|
|
Scottish Green
|
Caitlin Meldrum
|
2.8%
|
113
|
124.1
|
132.1
|
133.4
|
145.5
|
165.3
|
|
|
|
|
Liberal Democrats
|
Ryan Finnegan
|
2.7%
|
110
|
120.8
|
122.2
|
126.5
|
137.8
|
|
|
|
|
|
UKIP
|
William Morren
|
1.4%
|
56
|
58.3
|
58.9
|
|
|
|
|
|
|
|
TUSC
|
Ian McKay
|
1.3%
|
54
|
64.8
|
66.7
|
68.9
|
|
|
|
|
| Electorate: 12,113 Valid: 4,019 Spoilt: 562 Quota: 1,110 Turnout: 4,581 (37.8%)
|
The Ferry
- 2012: 2xSNP; 1xCon; 1xLab
- 2017: 2xCon; 1xLib Dem; 1xSNP
- 2012-2017: Conservative & Lib Dem each gain one seat from Labour & SNP.
The Ferry - 4 seats
| Party |
Candidate |
FPv% |
Count
|
| 1 |
2 |
3 |
4 |
5 |
6 |
7 |
8 |
9
|
|
|
Conservative
|
Derek Scott (incumbent)
|
31.8%
|
2,859
|
|
|
|
|
|
|
|
|
|
|
SNP
|
Kevin Cordell (incumbent)
|
17.9%
|
1,608
|
1,616.9
|
1,618.9
|
1,622.9
|
1,684.9
|
1,809.8
|
|
|
|
|
|
Liberal Democrats
|
Craig Duncan
|
15.8%
|
1,422
|
1,498.6
|
1,502.6
|
1,509.3
|
1,557.4
|
1,967.8
|
|
|
|
|
|
SNP
|
Vari McDonald *
|
12.0%
|
1,075
|
1,079.5
|
1,084.5
|
1,085.5
|
1,139.8
|
1,230.6
|
1,260.8
|
1,272.8
|
|
|
|
Labour
|
Angela Lyall
|
11.7%
|
1,054
|
1,079.3
|
1,093.3
|
1,097.3
|
1,139.7
|
|
|
|
|
|
|
Conservative
|
Philip Scott
|
7.1%
|
635
|
1,532.9
|
1,534.6
|
1,556.5
|
1,566.4
|
1,679.9
|
1,732.6
|
1,732.7
|
2,013.7
|
|
|
Scottish Green
|
Pol Clementsmith
|
2.6%
|
232
|
237.2
|
247.9
|
249.9
|
|
|
|
|
|
|
|
UKIP
|
Calum Walker
|
0.52%
|
47
|
50.7
|
52.7
|
|
|
|
|
|
|
|
|
TUSC
|
Paul Johnson
|
0.48%
|
43
|
44.9
|
|
|
|
|
|
|
|
| Electorate: 16,062 Valid: 8,975 Spoilt: 831 Quota: 1,796 Turnout: 9,153 (57%)
|
- = Outgoing Councillor from a different ward.
Aftermath
- † In February 2019, North East Labour Cllr. Brian Gordon died after a short illness. A by-election took place on 2 May 2019 which was won by Steven Rome of the SNP.[8][9]
- On 15 May 2019, North East SNP Cllr. Gregor Murray resigned from the party, accusing the party of being institutionally transphobic. Cllr. Murray continues to serve the ward as an Independent.[10]
- On 11 May 2021, Lochee SNP Cllr Alan Ross resigned from the party and became an Independent. On 4 February 2022, he joined the Alba Party, becoming the first Alba councillor in Dundee.[11][12]
North East by-election
In February 2019, North East Labour Cllr. Brian Gordon died after a short illness. A by-election took place on 2 May 2019 which was won by Steven Rome of the SNP.
North East by-election (2 May 2019) - 1 seat [9]
| Party |
Candidate |
FPv% |
Count
|
| 1 |
2 |
3 |
4 |
5 |
6
|
|
|
SNP
|
Steven Rome
|
46.9%
|
1,507
|
1,510
|
1,534
|
1,555
|
1,576
|
2,045
|
|
|
Labour
|
Jim Malone
|
38.1%
|
1,224
|
1,229
|
1,248
|
1,284
|
1,388
|
|
|
|
Conservative
|
Robert Lindsay
|
8.4%
|
271
|
274
|
280
|
290
|
|
|
|
|
TUSC
|
Michael Taylor
|
2.8%
|
91
|
109
|
122
|
|
|
|
|
|
Scottish Green
|
Alison Orr
|
2.4%
|
77
|
82
|
|
|
|
|
|
|
Citizens First
|
Roger Keech
|
1.4%
|
45
|
|
|
|
|
|
| Electorate: 11,434 Valid: 3,215 Spoilt: 31 Quota: 1,608 Turnout: 28.4%
|
Notes
- ^ Seat change from dissolution.
References