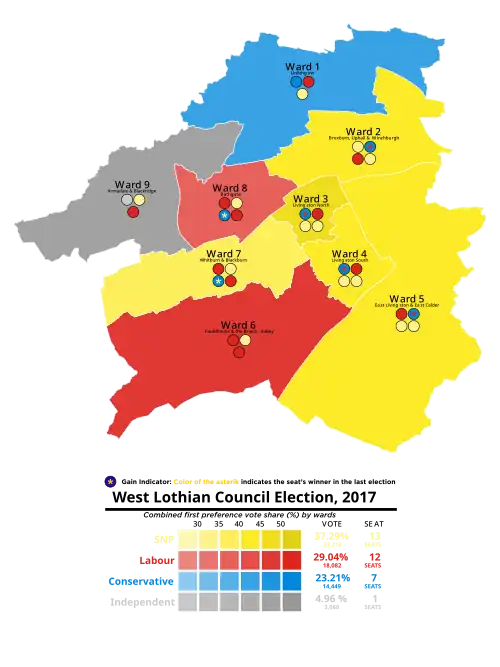
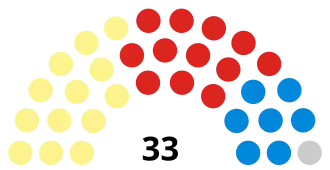
The 2017 West Lothian Council election took place on 4 May 2017. The election used the 9 wards created as a result of the Local Governance (Scotland) Act 2004, with each ward electing three or four Councillors using the single transferable vote system form of proportional representation, with 33 Councillors being elected. The election resulted in no overall party majority, leading to the Labour Party and the Conservative Party forming a coalition administration.
Results
2017 West Lothian local election result
| Party
|
Seats
|
Gains
|
Losses
|
Net gain/loss
|
Seats %
|
Votes %
|
Votes
|
+/−
|
|
|
SNP
|
13
|
0
|
2
|
 2 2
|
39.4
|
37.3
|
23,218
|
3.1
|
|
|
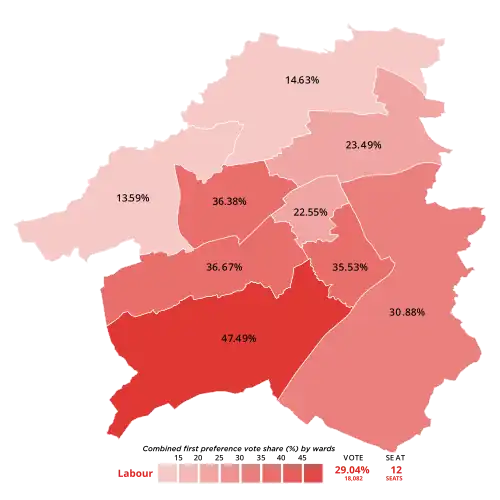
Labour
|
12
|
0
|
4
|
4
|
36.4
|
29.0
|
18,082
|
9.1
|
|
|
Conservative
|
7
|
6
|
0
|
 6 6
|
21.2
|
23.2
|
14,449
|
14.3
|
|
|
Independent
|
1
|
0
|
0
|

|
3.0
|
5.0
|
3,088
|
0.3
|
|
|
Scottish Green
|
0
|
0
|
0
|
|
0.0
|
2.7
|
1,695
|
New
|
|
|
Liberal Democrats
|
0
|
0
|
0
|
|
0.0
|
2.6
|
1,632
|
2.2
|
|
|
TUSC
|
0
|
0
|
0
|
|
0.0
|
0.1
|
57
|
New
|
|
|
UKIP
|
0
|
0
|
0
|
|
0.0
|
0.1
|
40
|
0.1
|
Note: "Votes" are the first preference votes. The net gain/loss and percentage changes relate to the result of the previous Scottish local elections in 2012. This may differ from other published sources showing gain/loss relative to seats held at dissolution of Scotland's councils.
Ward results
Linlithgow
- 2012: 1 x Conservative, 1 x SNP, 1 x Labour
- 2017: 1 x Conservative, 1 x SNP, 1 x Labour
- 2012-2017 Change: No Change
Linlithgow - 3 seats[1]
| Party |
Candidate |
FPv% |
Count
|
| 1 |
2 |
3 |
4 |
5 |
6 |
7
|
|
|
Conservative
|
Tom Kerr (incumbent)
|
41.92%
|
3,037
|
|
|
|
|
|
|
|
|
Labour
|
Tom Conn (incumbent)
|
14.63%
|
1,060
|
1,425
|
1,450
|
1,558
|
1,956
|
|
|
|
|
SNP
|
David Tait (incumbent)
|
16.01%
|
1,160
|
1,215
|
1,217
|
1,310
|
1,390
|
1,405
|
2,529
|
|
|
SNP
|
Sue Friel
|
15.06%
|
1,091
|
1,126
|
1,129
|
1,246
|
1,319
|
1,341
|
|
|
|
Liberal Democrats
|
Sally Pattle
|
5.26%
|
381
|
692
|
714
|
872
|
|
|
|
|
|
Scottish Green
|
Maire McCormack
|
6.57%
|
476
|
535
|
541
|
|
|
|
|
|
|
UKIP
|
Alan Cooper
|
0.55%
|
40
|
113
|
|
|
|
|
|
| Electorate: TBC Valid: 7,245 Spoilt: 74 Quota: 1,812 Turnout: 59.0%
|
Broxburn, Uphall and Winchburgh
- 2012: 2 x Labour, 2 x SNP
- 2017: 2 x SNP, 1 x Labour, 1 x Conservative
- 2012-2017 Change: 1 x Conservative gain from Labour
Broxburn, Uphall and Winchburgh - 4 seats[2]
| Party |
Candidate |
FPv% |
Count
|
| 1 |
2 |
3 |
4 |
5 |
6 |
7 |
8 |
9
|
|
|
SNP
|
Diane Calder (incumbent)
|
27.24%
|
1,898
|
|
|
|
|
|
|
|
|
|
|
Conservative
|
Chris Horne
|
27.23%
|
1,897
|
|
|
|
|
|
|
|
|
|
|
Labour
|
Angela Doran†††
|
19.00%
|
1,324
|
1,340
|
1,448
|
|
|
|
|
|
|
|
|
SNP
|
Janet Campbell (incumbent)
|
8.37%
|
583
|
868
|
880
|
882
|
894
|
961
|
990
|
1,057
|
1,666
|
|
|
SNP
|
Pippa Plevin
|
6.06%
|
422
|
571
|
577
|
577
|
580
|
626
|
668
|
739
|
|
|
|
Labour
|
Audrey Middleton
|
4.49%
|
313
|
318
|
368
|
410
|
423
|
467
|
628
|
|
|
|
|
Liberal Democrats
|
John Woods
|
3.12%
|
217
|
224
|
350
|
352
|
368
|
454
|
|
|
|
|
|
Scottish Green
|
June Douglas
|
3.67%
|
256
|
274
|
297
|
299
|
313
|
|
|
|
|
|
|
TUSC
|
Elaine Mallon
|
0.82%
|
57
|
59
|
72
|
74
|
|
|
|
|
|
| Electorate: TBC Valid: 6,967 Spoilt: 165 Quota: 1,394 Turnout: 46.2%
|
Livingston North
- 2012: 2 x SNP, 2 x Labour
- 2017: 2 x SNP, 1 x Labour, 1 x Conservative
- 2012-2017 Change: 1 x Conservative gain from Labour
Livingston North - 4 seats[3]
| Party |
Candidate |
FPv% |
Count
|
| 1 |
2 |
3 |
4 |
5 |
6 |
7
|
|
|
Conservative
|
Alison Adamson
|
25.45%
|
1,940
|
|
|
|
|
|
|
|
|
Labour
|
Dom McGuire
|
13.03%
|
993
|
1,077
|
1,092
|
1,209
|
1,898
|
|
|
|
|
SNP
|
Robert De Bold (incumbent)
|
16.31%
|
1,243
|
1,254
|
1,279
|
1,303
|
1,327
|
1,347
|
2,161
|
|
|
SNP
|
Andrew Miller (incumbent)
|
15.35%
|
1,170
|
1,175
|
1,207
|
1,235
|
1,260
|
1,297
|
1,606
|
|
|
SNP
|
Lorna Menzies Craig
|
14.53%
|
1,107
|
1,115
|
1,141
|
1,163
|
1,181
|
1,210
|
|
|
|
Labour
|
Anne McMillan (incumbent)
|
9.52%
|
726
|
764
|
782
|
853
|
|
|
|
|
|
Liberal Democrats
|
Caron Lindsay
|
3.28%
|
250
|
360
|
417
|
|
|
|
|
|
|
Scottish Green
|
Mark Wilkinson
|
2.53%
|
193
|
213
|
|
|
|
|
|
| Electorate: TBC Valid: 7,622 Spoilt: 123 Quota: 1,525 Turnout: 43.5%
|
Livingston South
- 2012: 2 x Labour, 2 x SNP
- 2017: 2 x SNP, 1 x Labour, 1 x Conservative
- 2012-2017 Change: 1 x Conservative gain from Labour
Livingston South - 4 seats[4]
| Party |
Candidate |
FPv% |
Count
|
| 1 |
2 |
3 |
4 |
5 |
6 |
7
|
|
|
Labour
|
Lawrence Fitzpatrick (incumbent)
|
27.12%
|
2,228
|
|
|
|
|
|
|
|
|
SNP
|
Peter Johnston (incumbent) †
|
20.69%
|
1,700
|
|
|
|
|
|
|
|
|
Conservative
|
Peter Heggie
|
19.40%
|
1,594
|
1,673
|
|
|
|
|
|
|
|
SNP
|
Moira Shemilt
|
13.02%
|
1,070
|
1,109
|
1,151
|
1,151
|
1,169
|
1,268
|
1,827
|
|
|
Labour
|
Danny Logue (incumbent)
|
8.41%
|
691
|
1,080
|
1,083
|
1,091
|
1,137
|
1,216
|
1,241
|
|
|
SNP
|
Annmargaret Watson
|
7.17%
|
589
|
593
|
598
|
599
|
602
|
620
|
|
|
|
Scottish Green
|
Jayne Glass
|
2.44%
|
200
|
221
|
223
|
225
|
275
|
|
|
|
|
Liberal Democrats
|
Jill Pattle
|
1.75%
|
144
|
154
|
155
|
160
|
|
|
|
| Electorate: TBC Valid: 8,216 Spoilt: 140 Quota: 1,644 Turnout: 46.3%
|
East Livingston and East Calder
- 2012: 2 x Labour, 2 x SNP
- 2017: 2 x SNP, 1 x Labour, 1 x Conservative
- 2012-2017 Change: 1 x Conservative gain from Labour
East Livingston and East Calder - 4 seats[5]
| Party |
Candidate |
FPv% |
Count
|
| 1 |
2 |
3 |
4 |
5 |
6 |
7
|
|
|
Labour
|
Dave King (incumbent)††
|
23.75%
|
1,749
|
|
|
|
|
|
|
|
|
Conservative
|
Damian Timson
|
22.00%
|
1,620
|
|
|
|
|
|
|
|
|
SNP
|
Frank Anderson (incumbent)
|
20.09%
|
1,479
|
|
|
|
|
|
|
|
|
SNP
|
Carl John (incumbent)
|
13.20%
|
972
|
994
|
998
|
1,002
|
1,014
|
1,105
|
1,648
|
|
|
Labour
|
Scott Rogers
|
7.13%
|
525
|
724
|
765
|
766
|
829
|
918
|
941
|
|
|
SNP
|
Veronica Smith
|
7.54%
|
555
|
561
|
564
|
565
|
578
|
652
|
|
|
|
Scottish Green
|
Neal Drummond
|
3.60%
|
265
|
274
|
284
|
285
|
366
|
|
|
|
|
Liberal Democrats
|
Charles Corser
|
2.69%
|
198
|
208
|
239
|
239
|
|
|
|
| Electorate: TBC Valid: 7,363 Spoilt: 141 Quota: 1,473 Turnout: 45.9%
|
Fauldhouse and the Breich Valley
- 2012: 2 x Labour, 1 x SNP
- 2017: 2 x Labour, 1 x SNP
- 2012-2017 Change: No Change
Fauldhouse and the Breich Valley - 3 seats[6]
| Party |
Candidate |
FPv% |
Count
|
| 1 |
2 |
3 |
4 |
5 |
6
|
|
|
Labour
|
David Dodds (incumbent)
|
29.81%
|
1,623
|
|
|
|
|
|
|
|
SNP
|
Pauline Clark
|
18.53%
|
1,012
|
1,022
|
1,035
|
1,079
|
1,781
|
|
|
|
Labour
|
Cathy Muldoon (incumbent)
|
17.68%
|
966
|
1,070
|
1,206
|
1,233
|
1,293
|
1,417
|
|
|
Conservative
|
Marion Kerr
|
15.23%
|
832
|
842
|
867
|
892
|
896
|
920
|
|
|
SNP
|
Greg McCarra (incumbent)
|
14.33%
|
783
|
787
|
794
|
817
|
|
|
|
|
Scottish Green
|
Pamela Barnes
|
2.25%
|
123
|
128
|
162
|
|
|
|
|
|
Liberal Democrats
|
Kenneth Brown
|
2.27%
|
124
|
127
|
|
|
|
|
| Electorate: TBC Valid: 5,463 Spoilt: 159 Quota: 1,366 Turnout: 46.6%
|
Whitburn and Blackburn
- 2012: 2 x Labour, 2 x SNP
- 2017: 2 x Labour, 1 x SNP, 1 x Conservative
- 2012-2017 Change: 1 x Conservative gain from SNP
Whitburn and Blackburn - 4 seats[7]
| Party |
Candidate |
FPv% |
Count
|
| 1 |
2 |
3 |
4 |
5 |
6 |
7
|
|
|
Labour
|
George Paul (incumbent)
|
28.08%
|
1,822
|
|
|
|
|
|
|
|
|
SNP
|
Jim Dickson (incumbent)
|
24.44%
|
1,586
|
|
|
|
|
|
|
|
|
Conservative
|
Bruce Fairbairn
|
21.99%
|
1,427
|
|
|
|
|
|
|
|
|
Labour
|
Kirsteen Sullivan
|
8.59%
|
557
|
1,015
|
1,020
|
1,054
|
1,149
|
1,209
|
1,486
|
|
|
SNP
|
Mary Dickson (incumbent)
|
7.75%
|
503
|
519
|
742
|
744
|
766
|
1,129
|
|
|
|
SNP
|
John Leslie
|
6.47%
|
420
|
426
|
468
|
470
|
481
|
|
|
|
|
Liberal Democrats
|
Bob Howden
|
2.68%
|
174
|
182
|
186
|
224
|
|
|
|
| Electorate: TBC Valid: 6,489 Spoilt: 175 Quota: 1,298 Turnout: 42.6%
|
Bathgate
- 2012: 2 x Labour, 2 x SNP
- 2017: 2xLabour; 1xSNP; 1xConservative
- 2012-2017 Change: Conservative gain one seat from SNP
Bathgate - 4 seats[8]
| Party |
Candidate |
FPv% |
Count
|
| 1 |
2 |
3 |
4 |
5 |
6 |
7
|
|
|
SNP
|
William Hannah Boyle (incumbent)
|
20.20%
|
1,554
|
|
|
|
|
|
|
|
|
Labour
|
Harry Cartmill (incumbent)
|
21.40%
|
1,646
|
|
|
|
|
|
|
|
|
Labour
|
John McGinty (incumbent)
|
14.98%
|
1,152
|
1,227
|
1,228
|
1,257
|
1,278
|
1,291
|
1,597
|
|
|
Conservative
|
Charles Kennedy
|
17.93%
|
1,379
|
1,388
|
1,389
|
1,400
|
1,409
|
1,413
|
1,574
|
|
|
SNP
|
Barry Burrows
|
8.49%
|
653
|
658
|
668
|
675
|
709
|
1,031
|
1,176
|
|
|
Independent
|
James Walker
|
9.68%
|
745
|
752
|
752
|
765
|
795
|
806
|
|
|
|
SNP
|
Lisa McArthur
|
4.50%
|
346
|
347
|
350
|
355
|
380
|
|
|
|
|
Scottish Green
|
Dale McDowell
|
1.56%
|
120
|
122
|
123
|
143
|
|
|
|
|
|
Liberal Democrats
|
Fiona Ann Stevens
|
1.26%
|
97
|
98
|
98
|
|
|
|
|
| Electorate: TBC Valid: 7,692 Spoilt: 174 Quota: 1,539 Turnout: 45.1%
|
Armadale and Blackridge
- 2012: 1 x Independent, 1 x Labour, 1 x SNP
- 2017: 1 x Independent, 1 x Labour, 1 x SNP
- 2012-2017 Change: No Change
Armadale and Blackridge - 3 seats[9]
| Party |
Candidate |
FPv% |
Count
|
| 1 |
2 |
3 |
4 |
5 |
6
|
|
|
Independent
|
Stuart Borrowman (incumbent)
|
45.02%
|
2,343
|
|
|
|
|
|
|
|
SNP
|
Sarah King (incumbent)
|
25.41%
|
1,322
|
|
|
|
|
|
|
|
Labour
|
Andrew McGuire
|
13.59%
|
707
|
1,012
|
1,016
|
1,056
|
1,131
|
1,589
|
|
|
Conservative
|
Ian Burgess
|
13.89%
|
723
|
1,016
|
1,017
|
1,035
|
1,057
|
|
|
|
Scottish Green
|
Paula Stokes
|
1.19%
|
62
|
149
|
157
|
189
|
|
|
|
|
Liberal Democrats
|
Chris Smillie
|
0.90%
|
47
|
117
|
118
|
|
|
|
| Electorate: TBC Valid: 5,204 Spoilt: 56 Quota: 1,302 Turnout: 42.20%
|
Aftermath
On 26 October 2021 Broxburn, Uphall and Winchburgh Labour Cllr Angela Doran-Timson left the Labour Party and joined the Conservatives.[10]
Livingston South by-election
On 29 March 2020 Livingston South SNP Councillor Peter Johnston resigned his seat due to illness.[11] The By-Election was postponed due to the ongoing Coronavirus Pandemic.[12] The By Election was held on Thursday 11 March 2021. The seat was won by the SNP candidate, Maria MacAulay.
Livingston South by-election (11 March 2021) - 1 seat[13]
| Party |
Candidate |
FPv% |
Count
|
| 1 |
2 |
3 |
4 |
5 |
6 |
7
|
|
|
SNP
|
Maria MacAulay
|
43.9%
|
2,465
|
2,467
|
2,496
|
2,603
|
2,703
|
2,763
|
3,370
|
|
|
Labour
|
Gordon Connolly
|
24.6%
|
1,382
|
1,384
|
1,419
|
1,481
|
1,579
|
2,098
|
|
|
Conservative
|
Douglas Smith
|
17.6%
|
989
|
996
|
1,025
|
1,037
|
1,124
|
|
|
Independent
|
Eddie Millar
|
5.9%
|
332
|
338
|
365
|
413
|
|
|
Scottish Green
|
Cameron Glasgow
|
4.2%
|
234
|
234
|
273
|
|
|
Liberal Democrats
|
Caron Lindsay
|
3.3%
|
185
|
186
|
|
|
UKIP
|
John Mumford
|
0.5%
|
29
|
| Electorate: TBC Valid: 5,616 Spoilt: TBC Quota: 2,809 Turnout: 30.2%
|
East Livingston and East Calder by-election
On 11 May 2021 East Livingston and East Calder Labour Cllr Dave King died. A by-election was held on 5 August 2021 and was gained by the SNP's Thomas Ullathorne.
East Livingston and East Calder by-election (5 August 2021) - 1 seat[14]
| Party |
Candidate |
FPv% |
Count
|
| 1 |
2 |
3 |
4 |
5
|
|
|
SNP
|
Thomas Ullathorne
|
42.5
|
1,890
|
1,906
|
1,918
|
2,122
|
2,368
|
|
|
Conservative
|
David Philip
|
24.4
|
1,085
|
1,088
|
1,103
|
1,131
|
1,425
|
|
|
Labour
|
Danny Logue
|
21.8
|
969
|
972
|
1,012
|
1,094
|
|
|
|
Scottish Green
|
Neal Drummond
|
7.6
|
336
|
343
|
377
|
|
|
|
|
Liberal Democrats
|
Hans Edginton
|
2.7
|
118
|
122
|
|
|
|
|
|
ISP
|
John Hannah
|
1.1
|
47
|
|
|
|
|
| Electorate: TBC Valid: 4,445 Spoilt: 48 Quota: 2,223 Turnout: 4,493 (25.1%)
|
References