2018 Reigate and Banstead Borough Council election
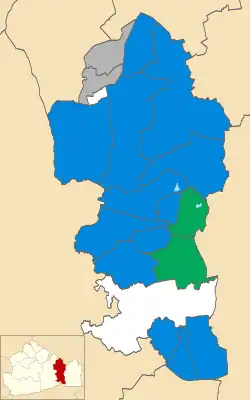
The 2018 Reigate and Banstead Borough Council election took place on 3 May 2018 to elect members of Reigate and Banstead Borough Council in England.[1] This was on the same day as other local elections. The Conservatives remained the largest party on the council while increasing their majority by 1, gaining a seat from both UKIP and the Liberal Democrats, while losing one seat to the Green Party.
Election result
| Party | Seats | Gains | Losses | Net gain/loss | Seats % | Votes % | Votes | +/− | |
|---|---|---|---|---|---|---|---|---|---|
| Conservative | 14 | 2 | 1 | 77.8 | 49.6 | 16,745 | |||
| Green | 2 | 1 | 0 | 11.1 | 10.1 | 3,408 | |||
| Tattenhams RA | 1 | 0 | 0 | 5.6 | 3.6 | 1,202 | |||
| Nork RA | 1 | 0 | 0 | 5.6 | 3.3 | 1,124 | |||
| Labour | 0 | 0 | 0 | 0.0 | 17.3 | 5,853 | |||
| Liberal Democrats | 0 | 0 | 1 | 0.0 | 12.5 | 4,210 | |||
| UKIP | 0 | 0 | 1 | 0.0 | 3.7 | 1,233 | |||
Ward results
Banstead Village
| Party | Candidate | Votes | % | ±% | |
|---|---|---|---|---|---|
| Conservative | Samuel Walsh | 1,413 | 68.4 | ||
| Labour | Barbara Williams | 307 | 14.9 | New | |
| Liberal Democrats | Graham Burr | 259 | 12.5 | ||
| UKIP | Colin Stiff | 88 | 4.3 | ||
| Majority | 1,106 | 53.5 | |||
| Turnout | 2,073 | 33.7 | |||
| Conservative hold | Swing | ||||
Chipstead, Hooley and Woodmansterne
| Party | Candidate | Votes | % | ±% | |
|---|---|---|---|---|---|
| Conservative | Tim Archer | 1,367 | 63.8 | ||
| Labour | Peter Parrott | 276 | 12.9 | New | |
| Liberal Democrats | Chris Howell | 196 | 9.1 | New | |
| Green | Shasha Khan | 183 | 8.5 | New | |
| UKIP | Laurence Clack | 122 | 5.7 | ||
| Majority | 1,091 | 50.9 | |||
| Turnout | 2,149 | 32.4 | |||
| Conservative hold | Swing | ||||
Earlswood and Whitebushes
| Party | Candidate | Votes | % | ±% | |
|---|---|---|---|---|---|
| Green | Hal Brown | 760 | 32.8 | ||
| Conservative | Rita Renton | 743 | 32.1 | ||
| Labour | Toby Brampton | 505 | 21.8 | ||
| Liberal Democrats | Jane Kulka | 163 | 7.0 | ||
| UKIP | Joe Fox | 146 | 6.3 | ||
| Majority | 17 | 0.7 | N/A | ||
| Turnout | 2,325 | 35.1 | |||
| Green gain from Conservative | Swing | ||||
Horley Central
| Party | Candidate | Votes | % | ±% | |
|---|---|---|---|---|---|
| Conservative | Christian Stevens | 1,164 | 61.4 | ||
| Labour | Linda Mabbett | 732 | 38.6 | ||
| Majority | 432 | 22.8 | N/A | ||
| Turnout | 1,932 | 29.7 | |||
| Conservative gain from UKIP | Swing | ||||
Horley East
| Party | Candidate | Votes | % | ±% | |
|---|---|---|---|---|---|
| Conservative | Graham Knight | 1,184 | 66.1 | ||
| Labour | Nicholas Gulsen-Sales | 369 | 20.6 | ||
| Liberal Democrats | Monica Dyer | 239 | 13.3 | ||
| Majority | 815 | 45.5 | |||
| Turnout | 1,792 | 32.0 | |||
| Conservative hold | Swing | ||||
Horley West
| Party | Candidate | Votes | % | ±% | |
|---|---|---|---|---|---|
| Conservative | Alex Horwood | 957 | 48.0 | ||
| Conservative | Richard Biggs | 868 | 43.5 | N/A | |
| Labour | Rob Spencer | 440 | 22.1 | ||
| Labour | Tom Turner | 401 | 20.1 | N/A | |
| UKIP | Peter Palmer | 303 | 15.2 | ||
| Liberal Democrats | Geoffrey Southall | 292 | 14.7 | ||
| Majority | 517 | 25.9 | |||
| Turnout | 29.7 | ||||
| Conservative hold | Swing | ||||
| Conservative hold | Swing | ||||
Kingswood with Burgh Heath
| Party | Candidate | Votes | % | ±% | |
|---|---|---|---|---|---|
| Conservative | Rod Ashford | 1,454 | 80.9 | ||
| Labour | Gerry O'Dwyer | 223 | 12.4 | New | |
| UKIP | Alastair Richardson | 120 | 6.7 | ||
| Majority | 1,231 | 68.5 | |||
| Turnout | 1,807 | 32.3 | |||
| Conservative hold | Swing | ||||
Meadvale and St John's
| Party | Candidate | Votes | % | ±% | |
|---|---|---|---|---|---|
| Conservative | Jonathan White | 841 | 39.5 | ||
| Liberal Democrats | Stephen Kulka | 835 | 39.3 | ||
| Labour | Douglas Wickenden | 246 | 11.6 | ||
| Green | Sue Fenton | 205 | 9.6 | New | |
| Majority | 6 | 0.2 | N/A | ||
| Turnout | 2,135 | 36.9 | |||
| Conservative gain from Liberal Democrats | Swing | ||||
Merstham
| Party | Candidate | Votes | % | ±% | |
|---|---|---|---|---|---|
| Conservative | Graeme Crome | 797 | 44.5 | ||
| Labour | Stewart Dack | 578 | 32.3 | ||
| Liberal Democrats | Toby Risk | 272 | 15.2 | ||
| UKIP | Leigh Jones | 144 | 8.0 | ||
| Majority | 219 | 12.2 | |||
| Turnout | 1,795 | 31.1 | |||
| Conservative hold | Swing | ||||
Nork
| Party | Candidate | Votes | % | ±% | |
|---|---|---|---|---|---|
| Residents | Brian Stead | 1,124 | 55.9 | ||
| Conservative | Jane Illingworth | 568 | 28.3 | ||
| Labour | Alex Hubbard | 133 | 6.6 | New | |
| Liberal Democrats | Stephen Gee | 105 | 5.2 | New | |
| Green | Joseph Ingell | 79 | 3.9 | New | |
| Majority | 556 | 27.6 | |||
| Turnout | 2,015 | 32.1 | |||
| Residents hold | Swing | ||||
Redhill East
| Party | Candidate | Votes | % | ±% | |
|---|---|---|---|---|---|
| Green | Jonathan Essex | 1,377 | 58.2 | ||
| Conservative | Paul Bevan | 573 | 24.2 | ||
| Labour | Rex Giles | 296 | 12.5 | ||
| Liberal Democrats | Stuart Holmes | 121 | 5.1 | ||
| Majority | 804 | 34.0 | |||
| Turnout | 2,374 | 32.3 | |||
| Green hold | Swing | ||||
Redhill West
| Party | Candidate | Votes | % | ±% | |
|---|---|---|---|---|---|
| Conservative | Rich Michalowski | 984 | 44.0 | ||
| Labour | Jon Pepper | 593 | 26.5 | ||
| Green | Ruth Ritter | 322 | 14.4 | ||
| Liberal Democrats | Andrew Cressy | 256 | 11.5 | ||
| UKIP | Steven Richards | 80 | 3.6 | ||
| Majority | 391 | 17.5 | |||
| Turnout | 2,237 | 36.6 | |||
| Conservative hold | Swing | ||||
Reigate Central
| Party | Candidate | Votes | % | ±% | |
|---|---|---|---|---|---|
| Conservative | Michael Blacker | 1,005 | 48.1 | ||
| Liberal Democrats | John Vincent | 546 | 26.1 | ||
| Green | Elizabeth Wakefield | 286 | 13.7 | ||
| Labour | Michele David | 253 | 12.1 | ||
| Majority | 459 | 22.0 | |||
| Turnout | 2,095 | 38.9 | |||
| Conservative hold | Swing | ||||
Reigate Hill
| Party | Candidate | Votes | % | ±% | |
|---|---|---|---|---|---|
| Conservative | Gareth Owen | 1,002 | 66.0 | ||
| Liberal Democrats | Gregory Ardan | 375 | 24.7 | New | |
| Labour | Denise Allen | 141 | 9.3 | ||
| Majority | 627 | 41.3 | |||
| Turnout | 1,524 | 35.2 | |||
| Conservative hold | Swing | ||||
South Park and Woodhatch
| Party | Candidate | Votes | % | ±% | |
|---|---|---|---|---|---|
| Conservative | Victor Lewanski | 826 | 45.8 | ||
| Labour | Tony Robinson | 476 | 26.4 | ||
| Liberal Democrats | Moray Carey | 354 | 19.6 | ||
| UKIP | Chris Byrne | 148 | 8.2 | ||
| Majority | 350 | 19.4 | |||
| Turnout | 1,807 | 33.7 | |||
| Conservative hold | Swing | ||||
Tadworth and Walton
| Party | Candidate | Votes | % | ±% | |
|---|---|---|---|---|---|
| Conservative | Rachel Turner | 1,410 | 71.8 | ||
| Liberal Democrats | Sonja Begley-Moore | 197 | 10.0 | ||
| Green | Roger Ponsford | 146 | 7.4 | ||
| Labour | David Burnley | 130 | 6.6 | New | |
| UKIP | Valerie Moore | 82 | 4.2 | ||
| Majority | 1,213 | 61.8 | |||
| Turnout | 1,967 | 35.7 | |||
| Conservative hold | Swing | ||||
Tattenhams
| Party | Candidate | Votes | % | ±% | |
|---|---|---|---|---|---|
| Residents | Bob Harper | 1,202 | 64.5 | ||
| Conservative | Frances Clarke | 457 | 24.5 | ||
| Labour | Jake Bonner | 155 | 8.3 | New | |
| Green | Alistair Morten | 50 | 2.7 | New | |
| Majority | 745 | 40.0 | |||
| Turnout | 1,869 | 32.6 | |||
| Residents hold | Swing | ||||
References
- ^ "Borough Council Election results". Reigate & Banstead Borough Council. Retrieved 6 June 2022.