2022 Reigate and Banstead Borough Council election
| |||||||||||||||||||||||||||||||||||||||||
15 out of 45 seats to Reigate and Banstead Borough Council 23 seats needed for a majority | |||||||||||||||||||||||||||||||||||||||||
|---|---|---|---|---|---|---|---|---|---|---|---|---|---|---|---|---|---|---|---|---|---|---|---|---|---|---|---|---|---|---|---|---|---|---|---|---|---|---|---|---|---|
| |||||||||||||||||||||||||||||||||||||||||
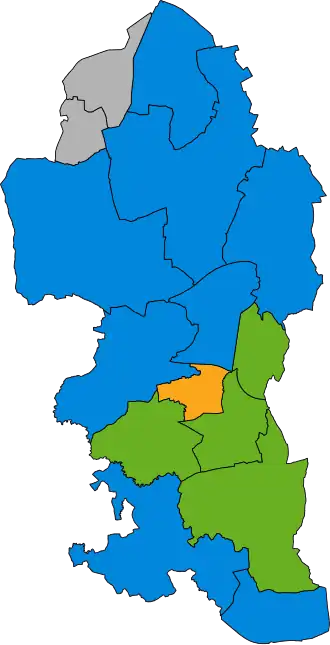 Winner of each seat at the 2022 Reigate and Banstead Borough Council election | |||||||||||||||||||||||||||||||||||||||||
| |||||||||||||||||||||||||||||||||||||||||
The 2022 Reigate and Banstead Borough Council election took place on 5 May 2022 to elect members to Reigate and Banstead Borough Council in England coinciding with other local elections. Fifteen of the council's 45 seats were up for election.[1]
The Conservatives won eight of the fifteen seats available, retaining control of the council which they have held since 2000. The Green Party gained two seats, Horley East & Salfords and South Park & Woodhatch, from the Conservatives to remain the second-largest party. The only other seat to switch parties was Reigate which the Conservatives won from the independent incumbent Christopher Whinney.[1][2]
Results summary
| 2022 Reigate and Banstead Borough Council election[2] | ||||||||||
|---|---|---|---|---|---|---|---|---|---|---|
| Party | This election | Full council | This election | |||||||
| Seats | Net | Seats % | Other | Total | Total % | Votes | Votes % | +/− | ||
| Conservative | 8 | 53.3 | 19 | 27 | 60.0 | 13,696 | 36.6 | -10.5 | ||
| Green | 4 | 26.7 | 5 | 9 | 20.0 | 8,914 | 23.8 | +2.9 | ||
| Liberal Democrats | 1 | 6.7 | 2 | 3 | 6.7 | 3,898 | 10.4 | +1.5 | ||
| Nork RA | 1 | 6.7 | 2 | 3 | 6.7 | 1,524 | 4.1 | -0.1 | ||
| Tattenham RA | 1 | 6.7 | 2 | 3 | 6.7 | 1,243 | 3.3 | +0.6 | ||
| Labour | 0 | 0.0 | 0 | 0 | 0.0 | 6,634 | 17.7 | +1.8 | ||
| Independent | 0 | 0.0 | 0 | 0 | 0.0 | 1,278 | 3.4 | N/A | ||
| Reform UK | 0 | 0.0 | 0 | 0 | 0.0 | 271 | 0.7 | N/A | ||
Ward results
Banstead Village
| Party | Candidate | Votes | % | ±% | |
|---|---|---|---|---|---|
| Conservative | Sam Walsh | 1,102 | 45.0 | −23.5 | |
| Independent | Mario Hayns | 738 | 30.1 | N/A | |
| Labour | Ian Thirlwall | 243 | 10.0 | 0.0 | |
| Liberal Democrats | Moray William Carey | 208 | 8.5 | −0.8 | |
| Green | Jennifer Pope | 158 | 6.5 | −5.7 | |
| Majority | 354 | 14.5 | |||
| Turnout | 2,449 | 36.5 | −1.5 | ||
| Conservative hold | Swing | ||||
Chipstead, Kingswood and Woodansterne
| Party | Candidate | Votes | % | ±% | |
|---|---|---|---|---|---|
| Conservative | Simon Parnall | 1,562 | 62.1 | −10.1 | |
| Green | Shasha Khan | 530 | 21.1 | +5.7 | |
| Labour | Geoff Eales | 425 | 16.9 | +4.5 | |
| Majority | 1,032 | 41.0 | |||
| Turnout | 2,517 | 34.2 | −4.8 | ||
| Conservative hold | Swing | ||||
Earlswood and Whitebushes
| Party | Candidate | Votes | % | ±% | |
|---|---|---|---|---|---|
| Green | Ruth Ritter | 1,604 | 65.3 | +6.7 | |
| Conservative | Kate Fairhurst | 499 | 20.3 | −14.9 | |
| Labour | Mark Scott | 353 | 14.4 | +2.5 | |
| Majority | 1,105 | 45.0 | |||
| Turnout | 2,456 | 34.6 | −3.4 | ||
| Green hold | Swing | ||||
Hooley, Merstham and Netherne
| Party | Candidate | Votes | % | ±% | |
|---|---|---|---|---|---|
| Conservative | Mus Tary | 958 | 35.1 | −7.1 | |
| Labour | Mick Hay | 734 | 26.9 | −4.4 | |
| Green | Sam Dilliway-Davies | 694 | 25.4 | +2.1 | |
| Liberal Democrats | Graham Burr | 343 | 12.6 | −8.8 | |
| Majority | 224 | 8.2 | |||
| Turnout | 2,729 | 34.5 | −0.5 | ||
| Conservative hold | Swing | ||||
Horley Central and South
| Party | Candidate | Votes | % | ±% | |
|---|---|---|---|---|---|
| Conservative | Hannah Avery | 1,101 | 48.1 | −9.5 | |
| Labour | Lynnette Easterbrook | 684 | 29.9 | +3.6 | |
| Green | Neville Kemp | 323 | 14.1 | −2.0 | |
| Reform UK | Chris Scott | 181 | 7.9 | N/A | |
| Majority | 417 | ||||
| Turnout | 2,289 | 31.1 | −1.9 | ||
| Conservative hold | Swing | ||||
Horley East and Salfords
| Party | Candidate | Votes | % | ±% | |
|---|---|---|---|---|---|
| Green | Victoria Chester | 1,049 | 41.7 | −0.4 | |
| Conservative | Robert Marr | 1,025 | 40.7 | −18.1 | |
| Labour | Tom Latter | 444 | 17.6 | −0.3 | |
| Majority | 24 | 1.0 | |||
| Turnout | 2,518 | 35.4 | −0.6 | ||
| Green gain from Conservative | Swing | ||||
Horley West and Sidlow
| Party | Candidate | Votes | % | ±% | |
|---|---|---|---|---|---|
| Conservative | James Baker | 1,079 | 48.2 | −10.6 | |
| Labour | Cecilia Hughes | 798 | 35.7 | +8.6 | |
| Liberal Democrats | Steve Wotton | 361 | 16.1 | +2.0 | |
| Majority | 281 | 12.6 | |||
| Turnout | 2,238 | 29.1 | −0.9 | ||
| Conservative hold | Swing | ||||
Lower Kingswood, Tadworth and Walton
| Party | Candidate | Votes | % | ±% | |
|---|---|---|---|---|---|
| Conservative | Rod Ashford | 1,720 | 62.5 | −5.3 | |
| Green | Roger Ponsford | 584 | 21.2 | +10.9 | |
| Labour | David Burnley | 448 | 16.3 | +7.2 | |
| Majority | 1,136 | 41.3 | |||
| Turnout | 2,752 | 35.4 | −3.6 | ||
| Conservative hold | Swing | ||||
Meadvale and St. John's
| Party | Candidate | Votes | % | ±% | |
|---|---|---|---|---|---|
| Liberal Democrats | Christopher Thompson | 1,585 | 56.4 | +13.4 | |
| Conservative | Ronnie Hutchings | 762 | 27.1 | −11.5 | |
| Labour | Rosie Norgrove | 461 | 16.4 | −0.1 | |
| Majority | 823 | 29.3 | |||
| Turnout | 2,808 | 42.6 | +0.6 | ||
| Liberal Democrats hold | Swing | ||||
Nork
| Party | Candidate | Votes | % | ±% | |
|---|---|---|---|---|---|
| Nork RA | George Hinton | 1,524 | 60.7 | +8.7 | |
| Conservative | Pamela Freeman | 572 | 22.8 | −1.5 | |
| Labour | Calli Mistry | 222 | 8.8 | +3.2 | |
| Green | Flip Bakker | 192 | 7.6 | N/A | |
| Majority | 952 | 37.9 | −0.1 | ||
| Turnout | 2,510 | 34.9 | |||
| Nork RA hold | Swing | ||||
Redhill East
| Party | Candidate | Votes | % | ±% | |
|---|---|---|---|---|---|
| Green | Stephen McKenna | 1,414 | 64.1 | −0.7 | |
| Conservative | Shysta Manzoor | 385 | 17.5 | −6.1 | |
| Labour | Rex Giles | 259 | 11.7 | +0.1 | |
| Liberal Democrats | Stuart Holmes | 148 | 6.7 | N/A | |
| Majority | 1,029 | 46.6 | |||
| Turnout | 2,206 | 35.9 | −3.1 | ||
| Green hold | Swing | ||||
Redhill West and Wray Common
| Party | Candidate | Votes | % | ±% | |
|---|---|---|---|---|---|
| Conservative | Rich Michalowski | 867 | 33.3 | −9.3 | |
| Labour | Mark Smith | 715 | 27.4 | +8.2 | |
| Liberal Democrats | Jemma De Vincenzo | 525 | 20.2 | +1.7 | |
| Green | Frank Percy | 498 | 19.1 | −0.6 | |
| Majority | 152 | 5.8 | |||
| Turnout | 2,605 | 36.6 | −1.4 | ||
| Conservative hold | Swing | ||||
Reigate
| Party | Candidate | Votes | % | ±% | |
|---|---|---|---|---|---|
| Conservative | Victor Lewanski | 1,062 | 34.8 | −14.4 | |
| Liberal Democrats | John Vincent | 728 | 23.9 | +2.9 | |
| Independent | Christopher Whinney | 540 | 17.7 | N/A | |
| Green | Claire Thorpe | 474 | 15.5 | −4.8 | |
| Labour | Tony Robinson | 248 | 8.1 | −1.4 | |
| Majority | 334 | 10.9 | |||
| Turnout | 3,052 | 41.7 | +2.3 | ||
| Conservative gain from Independent | Swing | ||||
South Park and Woodhatch
| Party | Candidate | Votes | % | ±% | |
|---|---|---|---|---|---|
| Green | Andrew Proudfoot | 1,280 | 56.7 | +4.4 | |
| Conservative | Chris Reynolds | 590 | 26.2 | −10.0 | |
| Labour | Linda Giles | 296 | 13.1 | +1.6 | |
| Reform UK | Joseph Fox | 90 | 4.0 | N/A | |
| Majority | 690 | 30.6 | |||
| Turnout | 2,256 | 35.3 | −3.7 | ||
| Green gain from Conservative | Swing | ||||
Tattenham Corner and Preston
| Party | Candidate | Votes | % | ±% | |
|---|---|---|---|---|---|
| Tattenham RA | Nick Harrison | 1,243 | 60.0 | +2.6 | |
| Conservative | Aaron Doherty | 412 | 19.9 | −3.6 | |
| Labour | Steve Boeje | 304 | 14.7 | +3.2 | |
| Green | Alistair Morten | 114 | 5.5 | +1.1 | |
| Majority | 831 | 40.1 | |||
| Turnout | 2,073 | 28.9 | −1.1 | ||
| Tattenham RA hold | Swing | ||||
References
- ^ a b "Borough Council elections results 2022". Reigate and Banstead Borough Council. Retrieved 6 May 2022.
- ^ a b "Reigate & Banstead election result". BBC News. 6 May 2022. Retrieved 6 May 2022.