2019 Worthing Borough Council election
| |||||||||||||||||||||||||||||||||||||||||||||||||||||||||||||||||||||||||||
11 of the 37 seats to Worthing Borough Council 19 seats needed for a majority | |||||||||||||||||||||||||||||||||||||||||||||||||||||||||||||||||||||||||||
|---|---|---|---|---|---|---|---|---|---|---|---|---|---|---|---|---|---|---|---|---|---|---|---|---|---|---|---|---|---|---|---|---|---|---|---|---|---|---|---|---|---|---|---|---|---|---|---|---|---|---|---|---|---|---|---|---|---|---|---|---|---|---|---|---|---|---|---|---|---|---|---|---|---|---|---|
| |||||||||||||||||||||||||||||||||||||||||||||||||||||||||||||||||||||||||||
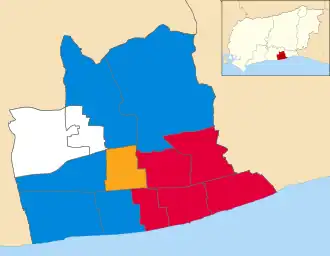 Map showing the election results. Each ward had one seat up for election (bar Durrington and Northbrook). | |||||||||||||||||||||||||||||||||||||||||||||||||||||||||||||||||||||||||||
| |||||||||||||||||||||||||||||||||||||||||||||||||||||||||||||||||||||||||||
The 2019 Worthing Borough Council election took place on 2 May 2019 to elect members of Worthing Borough Council. This was on the same day as other local elections. A third of the council was up for election, meaning a total of 11 councillors were elected from council's wards, there being no election in Durrington and Northbrook in this cycle.[1]
Council results
| 2019 Worthing Borough Council election | |||||||||||||||
|---|---|---|---|---|---|---|---|---|---|---|---|---|---|---|---|
| Party | Candidates | Votes | |||||||||||||
| Stood | Elected | Gained | Unseated | Net | % of total | % | No. | Net % | |||||||
| Conservative | 11 | 5 | 0 | 6 | -6 | 45.5 | 36.5 | 9,499 | -7.8 | ||||||
| Labour | 11 | 5 | 5 | 0 | +5 | 45.5 | 31.0 | 8,063 | +15.7 | ||||||
| Liberal Democrats | 11 | 1 | 1 | 0 | +1 | 9 | 14.8 | 3,850 | +2.9 | ||||||
| Green | 9 | 0 | 0 | 0 | 0 | 0 | 9.9 | 2,581 | +0.1 | ||||||
| UKIP | 6 | 0 | 0 | 0 | 0 | 0 | 7.2 | 1,871 | -11.6 | ||||||
| Independent | 1 | 0 | 0 | 0 | 0 | 0 | 0.565 | 147 | N/A | ||||||
Ward results
Broadwater ward
| Party | Candidate | Votes | % | ±% | |
|---|---|---|---|---|---|
| Labour | Dawn Smith | 962 | 45.0 | ||
| Conservative | Nigel Morgan | 671 | 31.3 | ||
| Green | Richard Battson | 266 | 12.4 | ||
| Liberal Democrats | John Apsey | 242 | 11.3 | ||
| Majority | 191 | 13.7 | |||
| Turnout | 2141 | 32.2 | |||
| Labour gain from Conservative | Swing | ||||
Castle ward
| Party | Candidate | Votes | % | ±% | |
|---|---|---|---|---|---|
| Conservative | Lionel Harman | 693 | 35.4 | ||
| Labour | Samuel Theodoridi | 369 | 18.8 | ||
| Liberal Democrats | Matt Hoyland | 362 | 18.4 | ||
| UKIP | Stuart Field | 311 | 15.9 | ||
| Green | Julian Warwick | 225 | 11.5 | ||
| Majority | 324 | 16.6 | |||
| Turnout | 1960 | 28.9 | |||
| Conservative hold | Swing | ||||
Central ward
| Party | Candidate | Votes | % | ±% | |
|---|---|---|---|---|---|
| Labour | Sally Smith | 1,131 | 44.9 | ||
| Conservative | Diane Guest | 627 | 24.9 | ||
| Green | Jo Paul | 517 | 20.5 | ||
| Liberal Democrats | Christine Brown | 243 | 9.7 | ||
| Majority | 504 | 20.0 | |||
| Turnout | 2518 | 33.1 | |||
| Labour gain from Conservative | Swing | ||||
Gaisford ward
| Party | Candidate | Votes | % | ±% | |
|---|---|---|---|---|---|
| Labour | Henna Chowdhury | 1,213 | 47.0 | ||
| Conservative | Bryan Turner | 951 | 36.8 | ||
| Liberal Democrats | Caroline Griffiths | 418 | 16.2 | ||
| Majority | 262 | 10.2 | |||
| Turnout | 2582 | 37.5 | |||
| Labour gain from Conservative | Swing | ||||
Goring ward
| Party | Candidate | Votes | % | ±% | |
|---|---|---|---|---|---|
| Conservative | Roy Barraclough | 1,295 | 49.1 | ||
| UKIP | Richard Bater | 368 | 14.0 | ||
| Labour | Stephanie Powell | 347 | 13.1 | ||
| Green | David Aherne | 333 | 12.6 | ||
| Liberal Democrats | Cyril Cannings | 296 | 11.2 | ||
| Majority | 927 | 35.1 | |||
| Turnout | 2639 | 38.6 | |||
| Conservative hold | Swing | ||||
Heene ward
| Party | Candidate | Votes | % | ±% | |
|---|---|---|---|---|---|
| Labour | Helen Silman | 866 | 39.2 | ||
| Conservative | Gavin Poole | 758 | 34.3 | ||
| Green | Joseph Pearce | 277 | 12.5 | ||
| Liberal Democrats | Christine Allen | 163 | 7.4 | ||
| Independent | Joshy High | 147 | 6.6 | ||
| Majority | 108 | 4.9 | |||
| Turnout | 2211 | 34.7 | |||
| Labour gain from Conservative | Swing | ||||
Marine ward
| Party | Candidate | Votes | % | ±% | |
|---|---|---|---|---|---|
| Conservative | Tim Wills | 1,140 | 41.0 | ||
| Labour | Samuel Baeza | 907 | 32.6 | ||
| Green | Karen North | 267 | 9.6 | ||
| UKIP | Sue Jelliss | 234 | 8.4 | ||
| Liberal Democrats | Antony Brown | 232 | 8.4 | ||
| Majority | 233 | 8.4 | |||
| Turnout | 2780 | 41.7 | |||
| Conservative hold | Swing | ||||
Offington ward
| Party | Candidate | Votes | % | ±% | |
|---|---|---|---|---|---|
| Conservative | Daniel Humphreys | 1,260 | 53.2 | ||
| Liberal Democrats | Emma Norton | 474 | 20.0 | ||
| Labour | Jon Roser | 342 | 14.4 | ||
| UKIP | John Strange | 291 | 12.3 | ||
| Majority | 786 | 33.25 | |||
| Turnout | 2367 | 36.8 | |||
| Conservative hold | Swing | ||||
Salvington ward
| Party | Candidate | Votes | % | ±% | |
|---|---|---|---|---|---|
| Conservative | Noel Atkins | 1,027 | 44.6 | ||
| UKIP | Michael Jelliss | 431 | 18.7 | ||
| Labour | Emma Taylor | 316 | 13.7 | ||
| Liberal Democrats | Keith Sunderland | 284 | 12.3 | ||
| Green | Melanie Ling | 245 | 10.6 | ||
| Majority | 596 | 25.9 | |||
| Turnout | 2,303 | 32.4 | |||
| Conservative hold | Swing | ||||
Selden ward
| Party | Candidate | Votes | % | ±% | |
|---|---|---|---|---|---|
| Labour | Carl Walker | 1,098 | 48.0 | ||
| Conservative | Alex Harman | 696 | 30.4 | ||
| Green | Madeleine Weaver | 289 | 12.6 | ||
| Liberal Democrats | Yvonne Leonard | 204 | 8.9 | ||
| Majority | 402 | 17.6 | |||
| Turnout | 2,287 | 36.8 | |||
| Labour gain from Conservative | Swing | ||||
Tarring ward
| Party | Candidate | Votes | % | ±% | |
|---|---|---|---|---|---|
| Liberal Democrats | Martin McCabe | 932 | 42.3 | ||
| Labour | Rosey Whorlow | 492 | 22.3 | ||
| Conservative | Richard Nowak | 381 | 17.3 | ||
| UKIP | Toby Brothers | 236 | 10.7 | ||
| Green | Dominic Rhoden | 164 | 7.4 | ||
| Majority | 440 | 20.0 | |||
| Turnout | 2,205 | 34.9 | |||
| Liberal Democrats gain from Conservative | Swing | ||||
References
- ^ "Election Results". Worthing District Council Election Results 2019. Worthing District Council.
| West Sussex CC | |
|---|---|
| Adur | |
| Arun | |
| Chichester | |
| Crawley | |
| Horsham | |
| Mid Sussex | |
| Worthing | |
| |