2019 Staffordshire Moorlands District Council election
| |||||||||||||||||||||||||||||||||||||||||||||||||||||||||||
All 56 seats to Staffordshire Moorlands District Council 29 seats needed for a majority | |||||||||||||||||||||||||||||||||||||||||||||||||||||||||||
|---|---|---|---|---|---|---|---|---|---|---|---|---|---|---|---|---|---|---|---|---|---|---|---|---|---|---|---|---|---|---|---|---|---|---|---|---|---|---|---|---|---|---|---|---|---|---|---|---|---|---|---|---|---|---|---|---|---|---|---|
| |||||||||||||||||||||||||||||||||||||||||||||||||||||||||||
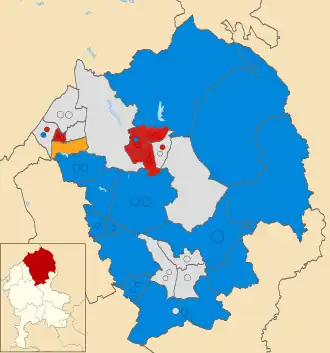 Winner of each seat at the 2019 Staffordshire Moorlands District Council election | |||||||||||||||||||||||||||||||||||||||||||||||||||||||||||
| |||||||||||||||||||||||||||||||||||||||||||||||||||||||||||
The 2019 Staffordshire Moorlands District Council election took place on 2 May 2019 to elect members of Staffordshire Moorlands District Council in England.[1] This was on the same day as other local elections.
Results summary
Election result
| 2019 Staffordshire Moorlands District Council election | ||||||||||
|---|---|---|---|---|---|---|---|---|---|---|
| Party | Candidates | Seats | Gains | Losses | Net gain/loss | Seats % | Votes % | Votes | +/− | |
| Conservative | 42 | 25 | 3 | 13 | 44.6 | 36.3 | 17,132 | –3.8 | ||
| Independent | 32 | 17 | 9 | 2 | 30.4 | 28.5 | 13,448 | +14.6 | ||
| Labour | 34 | 13 | 9 | 2 | 23.2 | 26.0 | 12,282 | +1.4 | ||
| Liberal Democrats | 8 | 1 | 0 | 1 | 1.8 | 4.2 | 1,969 | –0.5 | ||
| Green | 10 | 0 | 0 | 0 | 0.0 | 5.1 | 2,416 | +1.9 | ||
| UKIP | 0 | 0 | 0 | 2 | 0.0 | 0.0 | 0 | –3.3 | ||
Ward results
Alton
| Party | Candidate | Votes | % | ±% | |
|---|---|---|---|---|---|
| Conservative | Hayley Plimley | 320 | 66.5 | ||
| Labour | Jenny Lingham | 161 | 33.5 | ||
| Majority | |||||
| Turnout | 43.6 | ||||
| Conservative hold | Swing | ||||
Bagnall & Stanley
| Party | Candidate | Votes | % | ±% | |
|---|---|---|---|---|---|
| Conservative | Sybil Ralphs | 421 | 70.8 | ||
| Green | Helen Stead | 97 | 16.3 | ||
| Labour | Frances Naggs | 77 | 12.9 | ||
| Majority | |||||
| Turnout | 43.5 | ||||
| Conservative hold | Swing | ||||
Biddulph East
| Party | Candidate | Votes | % | ±% | |
|---|---|---|---|---|---|
| Labour | Jill Salt | 482 | 50.5 | ||
| Labour | Kevin Jackson | 453 | 47.4 | ||
| Labour | Connor Brady | 374 | 39.2 | ||
| Independent | Gerald Adams | 341 | 35.7 | ||
| Independent | Chris Perkin | 328 | 34.3 | ||
| Independent | Ken Harper | 199 | 20.8 | ||
| Conservative | Catharine Aberley | 155 | 16.2 | ||
| Turnout | 21.1 | ||||
| Labour hold | |||||
| Labour hold | |||||
| Labour hold | |||||
Biddulph Moor
| Party | Candidate | Votes | % | ±% | |
|---|---|---|---|---|---|
| Independent | John Jones | 479 | 80.5 | ||
| Conservative | Pam Gregory | 85 | 14.3 | ||
| Labour | Robert Whilding | 31 | 5.2 | ||
| Majority | |||||
| Turnout | 42.9 | ||||
| Independent hold | Swing | ||||
Biddulph North
| Party | Candidate | Votes | % | ±% | |
|---|---|---|---|---|---|
| Independent | Tony Hall | 885 | 64.6 | ||
| Independent | Jim Davies | 878 | 64.1 | ||
| Independent | Andrew Hart | 795 | 58.0 | ||
| Labour | Jim Bostock | 364 | 26.6 | ||
| Labour | Denver Johnson | 304 | 22.2 | ||
| Green | Ian Waite | 253 | 18.5 | ||
| Turnout | 30.3 | ||||
| Independent hold | |||||
| Independent hold | |||||
| Independent hold | |||||
Biddulph South
| Party | Candidate | Votes | % | ±% | |
|---|---|---|---|---|---|
| Liberal Democrats | John Redfern | 154 | 34.2 | ||
| Independent | Paul Barlow | 144 | 32.0 | ||
| Labour | Dave Proudlove | 89 | 19.8 | ||
| Conservative | Martin Graham | 63 | 14.0 | ||
| Majority | |||||
| Turnout | 36.7 | ||||
| Liberal Democrats hold | Swing | ||||
Biddulph West
| Party | Candidate | Votes | % | ±% | |
|---|---|---|---|---|---|
| Independent | Hilda Sheldon | 873 | 72.0 | ||
| Labour | Nigel Yates | 423 | 34.9 | ||
| Conservative | Ian Lawson | 374 | 30.9 | ||
| Conservative | Oliver McGuinness | 325 | 26.8 | ||
| Conservative | Stefan Trbovic | 179 | 14.8 | ||
| Turnout | 29.8 | ||||
| Independent hold | |||||
| Labour hold | |||||
| Conservative hold | |||||
Brown Edge & Endon
| Party | Candidate | Votes | % | ±% | |
|---|---|---|---|---|---|
| Conservative | Linda Lea | 653 | 48.4 | ||
| Conservative | Geoffrey Bond | 558 | 41.4 | ||
| Conservative | Joe Porter | 551 | 40.8 | ||
| Liberal Democrats | Louise Adams | 405 | 30.0 | ||
| Liberal Democrats | Mark Delf | 310 | 23.0 | ||
| Labour | Andrew Church | 271 | 20.1 | ||
| Green | Alison McCrea | 269 | 19.9 | ||
| Labour | Sam Chapple | 197 | 14.6 | ||
| Turnout | 34.8 | ||||
| Conservative hold | |||||
| Conservative hold | |||||
| Conservative gain from Liberal Democrats | |||||
Caverswall
| Party | Candidate | Votes | % | ±% | |
|---|---|---|---|---|---|
| Conservative | Paul Roberts | 322 | 80.1 | ||
| Labour | Andy Darrant | 80 | 19.9 | ||
| Majority | |||||
| Turnout | 28.7 | ||||
| Conservative hold | Swing | ||||
Cellarhead
| Party | Candidate | Votes | % | ±% | |
|---|---|---|---|---|---|
| Conservative | Tony McNicol | 389 | 58.4 | ||
| Conservative | Barbara Hughes | 342 | 51.4 | ||
| Green | Andrew Sharrock | 259 | 38.9 | ||
| Turnout | |||||
| Conservative hold | |||||
| Conservative hold | |||||
Cheadle North East
| Party | Candidate | Votes | % | ±% | |
|---|---|---|---|---|---|
| Independent | Ian Whitehouse | 372 | 51.0 | ||
| Independent | Phil Routledge | 252 | 34.6 | ||
| Independent | Paulette Upton | 175 | 24.0 | ||
| Independent | Julie Bull | 158 | 21.7 | ||
| Labour | Martin Chadwick | 125 | 17.1 | ||
| Independent | Alan Thomas | 98 | 13.4 | ||
| Green | Rachel Fairbanks | 65 | 8.9 | ||
| Turnout | 26.4 | ||||
| Independent gain from Conservative | |||||
| Independent gain from UKIP | |||||
Cheadle South East
| Party | Candidate | Votes | % | ±% | |
|---|---|---|---|---|---|
| Independent | Richard Alcock | 448 | 52.3 | ||
| Independent | Peter Elkin | 304 | 35.5 | ||
| Independent | Abigail Wilkinson | 247 | 28.9 | ||
| Labour | Adam Drane | 225 | 26.3 | ||
| Conservative | David Newport | 196 | 22.9 | ||
| Turnout | 29.2 | ||||
| Independent hold | Swing | ||||
| Independent gain from Conservative | Swing | ||||
Cheadle West
| Party | Candidate | Votes | % | ±% | |
|---|---|---|---|---|---|
| Independent | Kate Martin | 468 | 45.5 | ||
| Independent | Ian Plant | 422 | 41.0 | ||
| Independent | Gary Bentley | 397 | 38.6 | ||
| Independent | Ron Locker | 337 | 32.8 | ||
| Conservative | Stephen Ellis | 334 | 32.5 | ||
| Conservative | Peter Jackson | 251 | 24.4 | ||
| Conservative | Alan Banks | 246 | 23.9 | ||
| Independent | Add Lees | 196 | 19.0 | ||
| Turnout | 25.9 | ||||
| Independent gain from Conservative | |||||
| Independent gain from Conservative | |||||
| Independent gain from Conservative | |||||
Checkley
| Party | Candidate | Votes | % | ±% | |
|---|---|---|---|---|---|
| Conservative | Mark Deaville | 664 | 48.5 | ||
| Independent | Peter Wilkinson | 626 | 45.7 | ||
| Conservative | Alan Hulme | 557 | 40.7 | ||
| Independent | Sandra Peck | 389 | 28.4 | ||
| Conservative | Paul McCormack | 382 | 27.9 | ||
| Green | James Firkins | 307 | 22.4 | ||
| Labour | John Palfreyman | 287 | 20.9 | ||
| Turnout | 29.7 | ||||
| Conservative hold | |||||
| Independent gain from Conservative | |||||
| Conservative hold | |||||
Cheddleton
| Party | Candidate | Votes | % | ±% | |
|---|---|---|---|---|---|
| Conservative | Michael Bowen | 640 | 43.9 | ||
| Conservative | Mike Worthington | 627 | 43.0 | ||
| Conservative | Sav Scalise | 623 | 42.8 | ||
| Labour | Steven Proffitt | 517 | 35.5 | ||
| Labour | Ian Dakin | 441 | 30.3 | ||
| Labour | Mahfooz Ahmed | 410 | 28.1 | ||
| Liberal Democrats | Geoff Preston | 295 | 20.2 | ||
| Turnout | 34.0 | ||||
| Conservative hold | |||||
| Conservative hold | |||||
| Conservative hold | |||||
Churnet
| Party | Candidate | Votes | % | ±% | |
|---|---|---|---|---|---|
| Conservative | Elsie Fallows | 491 | 52.6 | ||
| Conservative | James Aberley | 458 | 49.0 | ||
| Independent | Ivor Lucas | 405 | 43.4 | ||
| Labour | Paul Powner | 175 | 18.7 | ||
| Turnout | 35.7 | ||||
| Conservative gain from Independent | |||||
| Conservative hold | |||||
Dane
| Party | Candidate | Votes | % | ±% | |
|---|---|---|---|---|---|
| Conservative | Gill Heath | 341 | 68.1 | ||
| Green | Mike Jones | 160 | 31.9 | ||
| Majority | |||||
| Turnout | 38.3 | ||||
| Conservative hold | Swing | ||||
Forsbrook
| Party | Candidate | Votes | % | ±% | |
|---|---|---|---|---|---|
| Conservative | Tony Holmes | 707 | 60.1 | ||
| Conservative | Ian Herdman | 652 | 55.4 | ||
| Conservative | Keith Flunder | 578 | 49.1 | ||
| Labour | Joanne Darrant | 557 | 47.4 | ||
| Turnout | 29.8 | ||||
| Conservative hold | |||||
| Conservative hold | |||||
| Conservative gain from UKIP | |||||
Hamps Valley
| Party | Candidate | Votes | % | ±% | |
|---|---|---|---|---|---|
| Conservative | Edwin Wain | 524 | 84.7 | ||
| Labour | Neil Singh | 95 | 15.3 | ||
| Turnout | 42.7 | ||||
| Conservative hold | Swing | ||||
Horton
| Party | Candidate | Votes | % | ±% | |
|---|---|---|---|---|---|
| Independent | Norma Hawkins | 366 | 60.2 | ||
| Conservative | Bob Cooper | 151 | 24.8 | ||
| Labour | Laura Robinson | 91 | 15.0 | ||
| Turnout | 39.9 | ||||
| Independent gain from Conservative | Swing | ||||
Ipstones
| Party | Candidate | Votes | % | ±% | |
|---|---|---|---|---|---|
| Independent | Linda Malyon | 511 | 74.5 | ||
| Conservative | Dan Newton | 175 | 25.5 | ||
| Turnout | 45.0 | ||||
| Independent hold | Swing | ||||
Leek East
| Party | Candidate | Votes | % | ±% | |
|---|---|---|---|---|---|
| Independent | Pamela Wood | 939 | 67.1 | ||
| Labour | Darren Price | 500 | 35.7 | ||
| Independent | Brian Johnson | 485 | 34.7 | ||
| Labour | Andrew Kidd | 424 | 30.3 | ||
| Independent | Stephen Wales | 388 | 27.7 | ||
| Conservative | Michael Howson | 332 | 23.7 | ||
| Liberal Democrats | Roy Gregg | 216 | 15.4 | ||
| Turnout | 35.5 | ||||
| Independent hold | |||||
| Labour gain from Conservative | |||||
| Independent gain from Conservative | |||||
Leek North
| Party | Candidate | Votes | % | ±% | |
|---|---|---|---|---|---|
| Labour | Charlotte Atkins | 731 | 62.2 | ||
| Labour | Lyn Swindlehurst | 548 | 46.6 | ||
| Labour | Lytton Page | 516 | 43.9 | ||
| Conservative | Dani Ogden | 384 | 32.7 | ||
| Independent | Charlotte Lockett | 361 | 30.7 | ||
| Turnout | 28.5 | ||||
| Labour hold | |||||
| Labour hold | |||||
| Labour gain from Conservative | |||||
Leek South
| Party | Candidate | Votes | % | ±% | |
|---|---|---|---|---|---|
| Labour | Mike Gledhill | 775 | 54.9 | ||
| Labour | Sue Coleman | 654 | 46.4 | ||
| Labour | Keith Hoptroff | 575 | 40.8 | ||
| Conservative | Jo Cox | 445 | 31.5 | ||
| Green | Daniella Vickerstaff | 352 | 24.9 | ||
| Liberal Democrats | Mike Ottewell | 214 | 15.2 | ||
| Independent | Gail Lockett | 182 | 12.9 | ||
| Turnout | 32.0 | ||||
| Labour hold | |||||
| Labour gain from Independent | |||||
| Labour gain from Conservative | |||||
Leek West
| Party | Candidate | Votes | % | ±% | |
|---|---|---|---|---|---|
| Labour | Bill Cawley | 714 | 53.0 | ||
| Conservative | Ben Emery | 591 | 43.9 | ||
| Labour | Phil Taylor | 560 | 41.6 | ||
| Conservative | Neal Podmore | 494 | 36.7 | ||
| Green | Mark Sidebotham | 382 | 28.4 | ||
| Conservative | Roy Molson | 351 | 26.1 | ||
| Liberal Democrats | Lee Jagger | 235 | 17.4 | ||
| Turnout | 36.8 | ||||
| Labour gain from Conservative | |||||
| Conservative hold | |||||
| Labour gain from Conservative | |||||
Manifold
| Party | Candidate | Votes | % | ±% | |
|---|---|---|---|---|---|
| Conservative | Teresa Riley | 357 | 64.6 | ||
| Liberal Democrats | Claire Wolstencroft | 140 | 25.3 | ||
| Labour | Jonathan Rowley | 56 | 10.1 | ||
| Majority | |||||
| Turnout | 38.4 | ||||
| Conservative hold | Swing | ||||
Werrington
| Party | Candidate | Votes | % | ±% | |
|---|---|---|---|---|---|
| Conservative | David Shaw | 440 | 63.1 | ||
| Conservative | Ross Ward | 404 | 58.0 | ||
| Green | Teresa Pattison | 272 | 39.0 | ||
| Turnout | 26.8 | ||||
| Conservative hold | |||||
| Conservative hold | |||||
Changes 2019–2023
By-elections
- 6 May 2021: Conservative gain (Stephen Ellis) in Cheadle North East following death of independent Ian Whitehouse.
- 6 May 2021: Conservative gain (Peter Jackson) in Cheadle South East following resignation of independent Peter Elkin.
- 5 May 2022: Conservative gain (Zenobia Routledge) in Cheadle South East following death of independent Richard Alcock.
| Party | Candidate | Votes | % | ±% | |
|---|---|---|---|---|---|
| Labour | Charlie Smith | 364 | 50.5 | ||
| Labour | Dave Proudlove | 288 | 39.9 | ||
| Independent | Neil Eardley | 226 | 31.3 | ||
| Conservative | Rathi Pragasam | 185 | 25.7 | ||
| Independent | Alistair McLoughlin | 154 | 21.4 | ||
| Green | Ian Waite | 61 | 8.5 | ||
| Turnout | 721 | 17.9 | |||
| Registered electors | 4,039 | ||||
| Labour gain from Conservative | |||||
| Labour gain from Independent | |||||
A double by-election after the deaths of incumbent Conservative (Ian Lawson) and independent (Hilda Sheldon) councillors.
Changes of allegiance
In May 2022, Norma Hawkins, Brian Johnson and Phil Routledge, all elected as independents, joined the Conservatives. At the same time, Michael Bowen, elected as a Conservative, left the party to sit as an independent. These changes gave the council an overall Conservative majority, having previously been under no overall control.[2]
References
- ^ "District, Town and Parish Elections 2nd May 2019 - Staffordshire Moorlands District Council". staffsmoorlands.gov.uk. Retrieved 22 May 2020.
- ^ Boothroyd, David (13 May 2022). "Post-election roundup". Local Councils. Thorncliffe. Retrieved 30 December 2023.