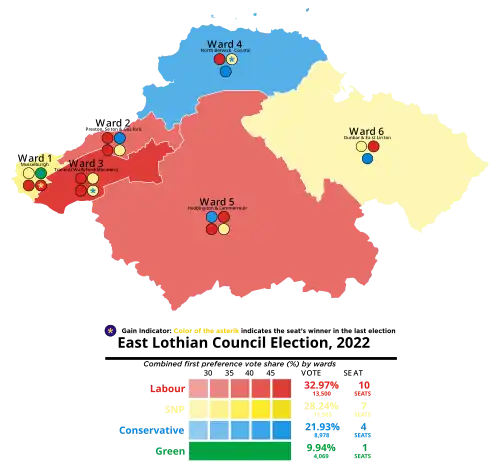
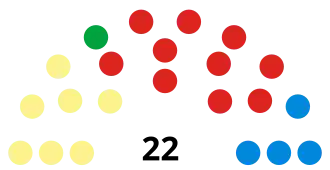
The 2022 East Lothian Council election took place on 5 May 2022 on the same day as the 31 other Scottish local government elections. The election used the 5 wards created under the Local Governance (Scotland) Act 2004, with 18 councillors being elected. Each ward elected either 3 or 4 members, using the STV electoral system.
Scottish Labour retained control of the council, whilst the Scottish Greens won their first ever seat in East Lothian.[1][2]
Aggregate results
2022 East Lothian Council election[3]
| Party
|
Seats
|
Gains
|
Losses
|
Net gain/loss
|
Seats %
|
Votes %
|
Votes
|
+/−
|
|
|
Labour
|
9
|
0
|
0
|
 0 0
|
41.0
|
32.6
|
12.426
|
 0.53 0.53
|
|
|
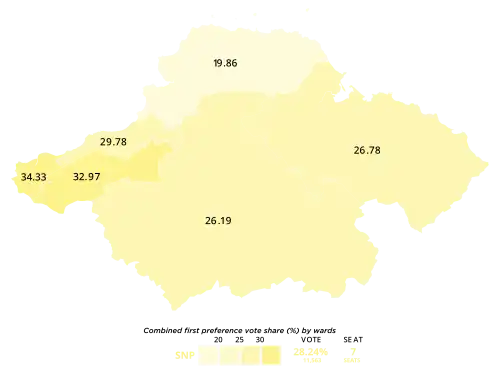
SNP
|
7
|
2
|
1
|
 1 1
|
32.0
|
28.24
|
11,563
|
0.34
|
|
|
Conservative
|
4
|
0
|
3
|
3
|
18.0
|
21.93
|
8,978
|
5.47
|
|
|
Scottish Green
|
1
|
1
|
0
|
1
|
4.5
|
9.94
|
4,069
|
5.45
|
|
|
Independent
|
1
|
1
|
0
|
1
|
4.5
|
3.12
|
1,192
|
2.81
|
|
|
Liberal Democrats
|
0
|
0
|
0
|
0
|
0.0
|
5.29
|
2,166
|
0.54
|
|
|
Alba
|
0
|
0
|
0
|
0
|
0.0
|
0.71
|
289
|
New
|
|
|
Scottish Family
|
0
|
0
|
0
|
0
|
0.0
|
0.39
|
146
|
New
|
|
|
TUSC
|
0
|
0
|
0
|
0
|
0.0
|
0.14
|
57
|
0.01
|
|
|
ISP
|
0
|
0
|
0
|
0
|
0.0
|
0.11
|
44
|
New
|
|
|
UKIP
|
0
|
0
|
0
|
0
|
0.0
|
0.04
|
18
|
New
|
Ward summary
Ward results
Musselburgh
Musselburgh − 4 seats[4]
| Party |
Candidate |
FPv% |
Count
|
| 1 |
2 |
3 |
4 |
5 |
6 |
7 |
8
|
|
|
SNP
|
Cher Cassini
|
21.70
|
1,596
|
|
|
|
|
|
|
|
|
|
Labour
|
Andrew Forrest (incumbent) [5]
|
16.44
|
1,209
|
1,214
|
1,222
|
1,231
|
1,287
|
1,425
|
1,472
|
|
|
|
Conservative
|
Katie Mackie (incumbent)
|
14.71
|
1,082
|
1,082
|
1,100
|
1,106
|
1,161
|
1,172
|
1,177
|
1,177
|
|
|
Labour
|
Ruaridh Bennett
|
14.60
|
1,074
|
1,078
|
1,081
|
1,091
|
1,160
|
1,234
|
1,276
|
1,276
|
|
|
Scottish Green
|
Shona Mcintosh
|
13.47
|
991
|
1,001
|
1,017
|
1,035
|
1,100
|
1,666
|
|
|
|
|
SNP
|
Iain Whyte
|
12.63
|
929
|
1,022
|
1,026
|
1,056
|
1,075
|
|
|
|
|
|
Liberal Democrats
|
Susan Butts
|
4.24
|
312
|
313
|
322
|
325
|
|
|
|
|
|
|
Alba
|
Michelle Graham
|
1.14
|
84
|
85
|
92
|
|
|
|
|
|
|
|
Scottish Family
|
Stephen Carter
|
1.07
|
79
|
79
|
|
|
|
|
|
|
| Electorate: 16,636 Valid: 7,356 Spoilt: 126 Quota: 1,472 Turnout: 45.0%
|
Preston Seton and Gosford
Preston, Seton and Gosford − 4 seats[6]
| Party |
Candidate |
FPv% |
Count
|
| 1 |
2 |
3 |
4 |
5 |
6 |
7
|
|
|
Labour
|
Colin Yorkston (incumbent)
|
24.4
|
1,569
|
|
|
|
|
|
|
|
|
Conservative
|
Lachlan Bruce (incumbent)
|
20.5
|
1,314
|
|
|
|
|
|
|
|
|
SNP
|
Neil Gilbert (incumbent)
|
18.0
|
1,156
|
1,160.34
|
1,160.74
|
1,185.74
|
1,199.92
|
1,203.16
|
1,313.89
|
|
|
Labour
|
Brooke Ritchie
|
15.2
|
978
|
1,220
|
1,227
|
1,232
|
1,328
|
|
|
|
|
SNP
|
Janis Wilson
|
11.8
|
756
|
763
|
763
|
774
|
787
|
791
|
914
|
|
|
Scottish Green
|
Tim Porteus
|
5.8
|
374
|
376
|
376
|
383
|
432
|
439
|
|
|
|
Liberal Democrats
|
Ben Morse
|
3.3
|
211
|
215
|
222
|
229
|
|
|
|
|
|
Alba
|
Paul Brown
|
1.0
|
66
|
66
|
66
|
|
|
|
|
| Electorate: 15,109 Valid: 6,421 Spoilt: 136 Quota: 1,285 Turnout: 43.4%
|
Tranent, Wallyford and Macmerry
Tranent, Wallyford and Macmerry − 4 seats[7]
| Party |
Candidate |
FPv% |
Count
|
| 1 |
2 |
3 |
4 |
5 |
6 |
7 |
8 |
9
|
|
|
Labour
|
Fiona Dugdale (incumbent)
|
24.0
|
1,437
|
|
|
|
|
|
|
|
|
|
|
SNP
|
Kenny McLeod (incumbent)
|
21.8
|
1,307
|
|
|
|
|
|
|
|
|
|
|
Labour
|
Colin McGinn (incumbent)
|
21.6
|
1,290
|
|
|
|
|
|
|
|
|
|
|
Conservative
|
Gordon Mackett (incumbent)
|
13.4
|
804
|
838
|
839
|
851
|
853
|
861
|
910
|
934
|
|
|
|
SNP
|
Lee-Anne Menzies
|
11.1
|
666
|
689
|
782
|
791
|
816
|
827
|
837
|
1,000
|
1,077
|
|
|
Scottish Green
|
Marnie Stirling
|
4.1
|
245
|
266
|
269
|
275
|
279
|
297
|
333
|
|
|
|
|
Liberal Democrats
|
Elizabeth Wilson
|
2.1
|
127
|
159
|
159
|
167
|
167
|
177
|
|
|
|
|
|
TUSC
|
Jimmy Haddow
|
1.0
|
57
|
73
|
73
|
80
|
89
|
|
|
|
|
|
|
Alba
|
Hazel Hamilton
|
0.9
|
51
|
54
|
55
|
57
|
|
|
|
|
|
| Electorate: 15,497 Valid: 5,984 Spoilt: 148 Quota: 1,197 Turnout: 39.6%
|
North Berwick Coastal
North Berwick Coastal − 3 seats[8]
| Party |
Candidate |
FPv% |
Count
|
| 1 |
2 |
3 |
4 |
5 |
6 |
7 |
8
|
|
|
Labour
|
Carol McFarlane
|
21.1
|
1,447
|
1,449
|
1,552
|
1,620
|
1,971
|
|
|
|
|
|
Conservative
|
Jeremy Findlay (incumbent)
|
20.3
|
1,389
|
1,391
|
1,395
|
1,431
|
1,468
|
1,510.93
|
1,521.78
|
2,714.1
|
|
|
SNP
|
Liz Allan
|
19.9
|
1,360
|
1,361
|
1,363
|
1,383
|
1,815
|
|
|
|
|
|
Conservative
|
Judy Lockhart-Hunter
|
18.7
|
1,280
|
1,282
|
1,288
|
1,338
|
1,373
|
1,410.30
|
1,418
|
|
|
|
Scottish Green
|
Jacq Cottrell
|
13.2
|
901
|
903
|
910
|
1,006
|
|
|
|
|
|
|
Liberal Democrats
|
Stuart Smith
|
6.2
|
425
|
425
|
429
|
|
|
|
|
|
|
|
Scottish Family
|
Alison Carter
|
0.4
|
29
|
33
|
|
|
|
|
|
|
|
|
UKIP
|
George Cowen
|
0.3
|
18
|
|
|
|
|
|
|
|
| Electorate: 12,181 Valid: 6,849 Spoilt: 78 Quota: 1,713 Turnout: 6,927 (56.9%)
|
Haddington and Lammermuir
Haddington and Lammermuir − 4 seats[9]
| Party |
Candidate |
FPv% |
Count
|
| 1 |
2 |
3 |
4 |
5 |
6 |
7 |
8 |
9
|
|
|
Conservative
|
George McGuire
|
21.89
|
1,714
|
|
|
|
|
|
|
|
|
|
|
Labour
|
Shamin Akhtar (incumbent)
|
20.75
|
1,625
|
|
|
|
|
|
|
|
|
|
|
Labour
|
John McMillan (incumbent)
|
15.68
|
1,228
|
1,271.22
|
1,310.66
|
1,319.85
|
1,344.62
|
1,542.60
|
1,714.0
|
|
|
|
|
SNP
|
Tom Trotter (incumbent)
|
14.14
|
1,107
|
1,109.06
|
1,110.52
|
1,124.35
|
1,131.73
|
1,148.86
|
1,351.07
|
1,378.05
|
2,350.54
|
|
|
SNP
|
Graeme MacGregor
|
12.06
|
944
|
945.72
|
949.63
|
970.46
|
982.49
|
1,003.38
|
1,154.26
|
1,168.20
|
|
|
|
Scottish Green
|
Jackie Swailes
|
7.37
|
577
|
580.94
|
584.37
|
591.49
|
609.29
|
725.00
|
|
|
|
|
|
Liberal Democrats
|
Stuart Crawford
|
5.52
|
432
|
469.91
|
474.47
|
478.73
|
533.41
|
|
|
|
|
|
|
Independent
|
David Barrett
|
0.37
|
29
|
132.65
|
134.27
|
148.44
|
|
|
|
|
|
|
|
Alba
|
Morgwn Davies
|
1.09
|
85
|
85.66
|
85.86
|
|
|
|
|
|
|
| Electorate: 16,204 Valid: 7,830 Spoilt: 121 Quota: 1,567 Turnout: 7,951 (49.1%)
|
Dunbar and East Linton
Dunbar and East Linton − 3 seats[10]
| Party |
Candidate |
FPv% |
Count
|
| 1 |
2 |
3 |
4 |
5 |
6
|
|
|
SNP
|
Lyn Jardine
|
26.84
|
1,742
|
|
|
|
|
|
|
|
Labour
|
Norman Hampshire (incumbent)
|
25.32
|
1,643
|
|
|
|
|
|
|
|
Conservative
|
Donna Collins
|
21.49
|
1,395
|
1,397.97
|
1,401.07
|
1,411.10
|
1,414.12
|
1,638.47
|
|
|
Scottish Green
|
Mark James
|
15.16
|
984
|
1,049.02
|
1,051.99
|
1,061.52
|
1,091.10
|
1,359.02
|
|
|
Liberal Democrats
|
Jacquie Bell
|
10.15
|
659
|
673.32
|
678.20
|
687.86
|
698.45
|
|
|
|
Scottish Family
|
Timothy Anderson
|
0.59
|
38
|
40.04
|
40.45
|
|
|
|
|
|
ISP
|
Cris Thacker
|
0.45
|
29
|
40.05
|
56.34
|
56.56
|
|
|
| Electorate: 16,204 Valid: 6,490 Spoilt: 121 Quota: 1,627 Turnout: 6,505 (40.1%)
|
References