Rugby Borough Council elections
Rugby Borough Council elections are held three years out of every four, with a third of the council elected each time. Rugby Borough Council is the local authority for the non-metropolitan district of Rugby in Warwickshire, England. Since the last boundary changes in 2012, 42 councillors have been elected from 16 wards.[1]
Summary of results
| Year | Labour | Conservatives | Liberal Democrats | Others |
|---|---|---|---|---|
| 2024 | 15 | 17 | 10 | 0 |
| 2023 | 12 | 21 | 9 | 0 |
| 2022 | 10 | 23 | 9 | 0 |
| 2018 | 9 | 24 | 9 | 0 |
| 2016 | 9 | 21 | 9 | 3 |
| 2011 | 11 | 29 | 8 | 0 |
| 2010 | 11 | 28 | 9 | 0 |
| 2007 | 11 | 27 | 10 | 0 |
| 2006 | 13 | 24 | 10 | 1 |
| 2004 | 14 | 21 | 10 | 3 |
| 2003 | 16 | 18 | 10 | 4 |
| 2002 | 16 | 18 | 10 | 4 |
| 2000 | 18 | 14 | 9 | 7 |
| 1999 | 22 | 11 | 7 | 8 |
| 1998 | 22 | 12 | 5 | 9 |
Council elections
- 1973 Rugby Borough Council election
- 1976 Rugby Borough Council election
- 1979 Rugby Borough Council election (New ward boundaries)[2]
- 1980 Rugby Borough Council election
- 1982 Rugby Borough Council election
- 1983 Rugby Borough Council election
- 1984 Rugby Borough Council election
- 1986 Rugby Borough Council election
- 1987 Rugby Borough Council election
- 1988 Rugby Borough Council election (Borough boundary changes took place but the number of seats remained the same)[3]
- 1990 Rugby Borough Council election
- 1991 Rugby Borough Council election
- 1992 Rugby Borough Council election
- 1994 Rugby Borough Council election (Borough boundary changes took place but the number of seats remained the same)[4]
- 1995 Rugby Borough Council election
- 1996 Rugby Borough Council election
- 1998 Rugby Borough Council election
- 1999 Rugby Borough Council election
- 2000 Rugby Borough Council election
- 2002 Rugby Borough Council election (New ward boundaries)[5][6]
- 2003 Rugby Borough Council election
- 2004 Rugby Borough Council election
- 2006 Rugby Borough Council election
- 2007 Rugby Borough Council election (Some new ward boundaries)[7]
- 2008 Rugby Borough Council election
- 2010 Rugby Borough Council election
- 2011 Rugby Borough Council election
- 2012 Rugby Borough Council election (New ward boundaries)[1]
- 2014 Rugby Borough Council election
- 2015 Rugby Borough Council election (Minor ward boundary changes)[8]
- 2016 Rugby Borough Council election
- 2018 Rugby Borough Council election
- 2019 Rugby Borough Council election
- 2021 Rugby Borough Council election
- 2022 Rugby Borough Council election
- 2023 Rugby Borough Council election
- 2024 Rugby Borough Council election
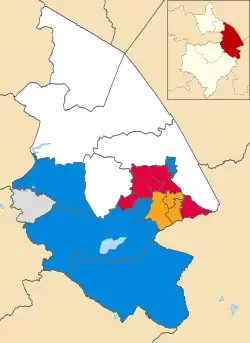
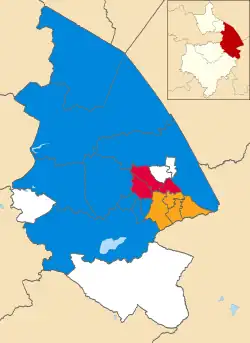
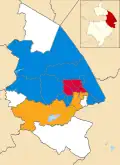
Results maps
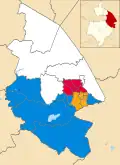
-
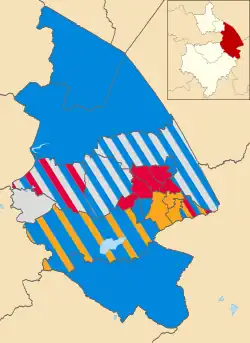 2002 results map
 -
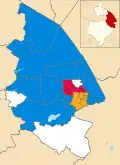
 2003 results map
 -
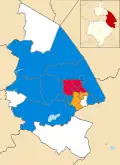
 2004 results map
 -
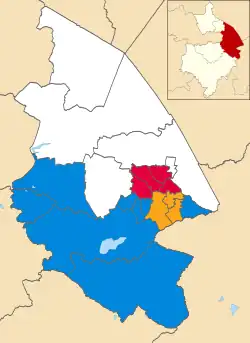
 2006 results map
 -
 2007 results map
 -
 2008 results map
 -
 2010 results map
 -
 2011 results map
 -
 2012 results map
 -
 2014 results map
 -
 2015 results map
 -
 2016 results map
 -
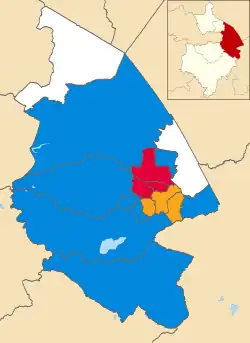
 2018 results map
 -
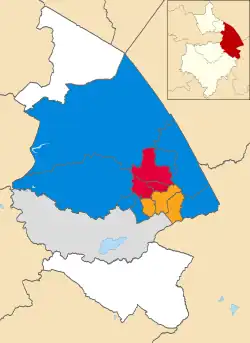
 2019 results map
 -
 2021 results map
 -
 2022 results map
 -
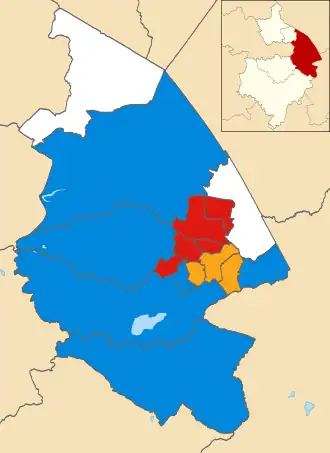 2023 results map
 -
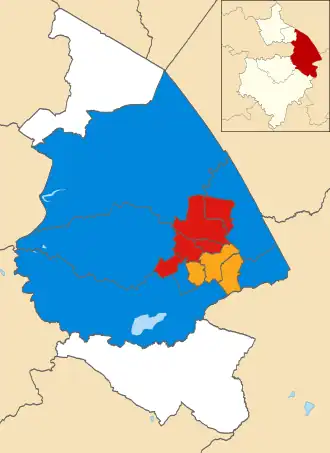 2024 results map
By-election results
1998–2002
| Party | Candidate | Votes | % | ±% | |
|---|---|---|---|---|---|
| Conservative | 419 | 41.1 | +2.8 | ||
| Labour | 387 | 38.0 | −8.5 | ||
| Liberal Democrats | 213 | 20.9 | +5.7 | ||
| Majority | 32 | 3.1 | |||
| Turnout | 1,019 | 22.2 | |||
| Conservative gain from Labour | Swing | ||||
| Party | Candidate | Votes | % | ±% | |
|---|---|---|---|---|---|
| Labour | 1,277 | 64.0 | +0.0 | ||
| Conservative | 387 | 19.4 | −4.1 | ||
| Liberal Democrats | 330 | 16.5 | +3.9 | ||
| Majority | 890 | 44.6 | |||
| Turnout | 1,994 | 57.2 | |||
| Labour hold | Swing | ||||
| Party | Candidate | Votes | % | ±% | |
|---|---|---|---|---|---|
| Labour | 1,050 | 37.4 | +10.1 | ||
| Liberal Democrats | 790 | 28.1 | +7.8 | ||
| Conservative | 620 | 22.1 | +1.4 | ||
| Independent | 350 | 12.5 | −19.1 | ||
| Majority | 260 | 9.3 | |||
| Turnout | 2,810 | 67.2 | |||
| Labour gain from Independent | Swing | ||||
| Party | Candidate | Votes | % | ±% | |
|---|---|---|---|---|---|
| Liberal Democrats | 1,256 | 44.7 | −11.1 | ||
| Labour | 792 | 28.2 | +13.1 | ||
| Conservative | 760 | 27.1 | −2.0 | ||
| Majority | 464 | 16.5 | |||
| Turnout | 2,808 | 71.7 | |||
| Liberal Democrats gain from Labour | Swing | ||||
| Party | Candidate | Votes | % | ±% | |
|---|---|---|---|---|---|
| Labour | 260 | 60.9 | −10.3 | ||
| Independent | 167 | 39.1 | +39.1 | ||
| Majority | 93 | 21.8 | |||
| Turnout | 427 | 19.4 | |||
| Labour hold | Swing | ||||
2002–2006
| Party | Candidate | Votes | % | ±% | |
|---|---|---|---|---|---|
| Liberal Democrats | Noreen New | 471 | 48.4 | −20.5 | |
| Conservative | Dave Cranham | 344 | 35.3 | +14.3 | |
| Labour | Benjamin Ferrett | 159 | 16.3 | +6.2 | |
| Majority | 127 | 13.1 | −34.8 | ||
| Turnout | 974 | 34 | −7.6 | ||
| Liberal Democrats hold | Swing | ||||
2006–2010
| Party | Candidate | Votes | % | ±% | |
|---|---|---|---|---|---|
| Conservative | 361 | 56.9 | −11.9 | ||
| Liberal Democrats | 153 | 24.1 | +9.0 | ||
| Labour | 84 | 13.2 | −2.8 | ||
| Green | 37 | 5.8 | +5.8 | ||
| Majority | 208 | 32.8 | |||
| Turnout | 635 | ||||
| Conservative hold | Swing | ||||
2010–2014
| Party | Candidate | Votes | % | ±% | |
|---|---|---|---|---|---|
| Conservative | Ian Lowe | 832 | 49.4 | +1.7 | |
| Liberal Democrats | Robert Aird | 682 | 40.5 | −0.8 | |
| Labour | Robert McNally | 149 | 8.9 | −0.4 | |
| Green | George Hougez | 20 | 1.2 | −0.5 | |
| Majority | 150 | 8.9 | |||
| Turnout | 1,683 | ||||
| Conservative hold | Swing | ||||
| Party | Candidate | Votes | % | ±% | |
|---|---|---|---|---|---|
| Labour | Steve Birkett | 496 | 49.3 | +1.9 | |
| Conservative | Katie Ferrier | 192 | 19.1 | −8.0 | |
| Green | Roy Sandison | 100 | 9.9 | −6.2 | |
| UKIP | Roy Harvey | 82 | 8.2 | +8.2 | |
| Independent | Patricia Wyatt | 56 | 5.6 | +5.6 | |
| Liberal Democrats | David Merritt | 41 | 4.1 | +4.1 | |
| TUSC | Pete McLaren | 39 | 3.9 | −5.5 | |
| Majority | 304 | 30.2 | |||
| Turnout | 1,006 | ||||
| Labour hold | Swing | ||||
| Party | Candidate | Votes | % | ±% | |
|---|---|---|---|---|---|
| Conservative | Martin Walton | 851 | 41.8 | −4.1 | |
| UKIP | Roy Harvey | 440 | 21.6 | +21.6 | |
| Labour | Owen Richards | 345 | 16.9 | −9.1 | |
| Liberal Democrats | Bill Lewis | 308 | 15.1 | −1.0 | |
| Green | Peter Reynolds | 57 | 2.8 | +2.8 | |
| TUSC | Steve Roberts | 37 | 1.8 | −10.3 | |
| Majority | 411 | 20.2 | |||
| Turnout | 2,038 | ||||
| Conservative hold | Swing | ||||
| Party | Candidate | Votes | % | ±% | |
|---|---|---|---|---|---|
| Conservative | Jim Buckley | 400 | 33.0 | −11.9 | |
| Labour | Barbara Brown | 339 | 28.0 | −1.8 | |
| UKIP | Roy Harvey | 231 | 19.1 | +19.1 | |
| Liberal Democrats | Tim Douglas | 221 | 18.2 | −0.4 | |
| Green | Peter Burrows | 21 | 1.7 | +1.7 | |
| Majority | 61 | 5.0 | |||
| Turnout | 1,212 | ||||
| Conservative hold | Swing | ||||
2014–2018
| Party | Candidate | Votes | % | ±% | |
|---|---|---|---|---|---|
| Conservative | Julie A'Barrow | 668 | 42.0 | −12.2 | |
| UKIP | Gordon Davies | 325 | 20.4 | +20.4 | |
| Liberal Democrats | Lesley George | 280 | 17.6 | +8.1 | |
| Labour | John Wells | 212 | 13.3 | −8.1 | |
| Independent | John Herman | 60 | 3.8 | +3.8 | |
| Green | Kate Crowley | 37 | 2.3 | −7.8 | |
| TUSC | Pete McLaren | 10 | 0.6 | −4.3 | |
| Majority | 343 | 21.5 | |||
| Turnout | 1,592 | ||||
| Conservative hold | Swing | ||||
| Party | Candidate | Votes | % | ±% | |
|---|---|---|---|---|---|
| Conservative | Sebastian Lowe | 809 | 52.2 | +5.9 | |
| Labour | Alan Webb | 533 | 34.4 | +4.4 | |
| Liberal Democrats | Jerome Perrier | 120 | 7.7 | −0.2 | |
| Green | Peter Reynolds | 89 | 5.7 | +5.7 | |
| Majority | 276 | 17.8 | |||
| Turnout | 1,551 | ||||
| Conservative hold | Swing | ||||
| Party | Candidate | Votes | % | ±% | |
|---|---|---|---|---|---|
| Labour | Mike Brader | 784 | 53.3 | +2.1 | |
| Conservative | Zoe Feeney | 505 | 34.3 | +4.9 | |
| Green | Roy Sandison | 107 | 7.3 | −1.9 | |
| Liberal Democrats | Hossain Tafazzal | 76 | 5.2 | +0.1 | |
| Majority | 279 | 19.0 | |||
| Turnout | 1,472 | ||||
| Labour hold | Swing | ||||
2018–2022
| Party | Candidate | Votes | % | ±% | |
|---|---|---|---|---|---|
| Liberal Democrats | Glenda Allanach | 963 | 56.1 | −7.1 | |
| Conservative | Deborah Keeling | 346 | 20.2 | +1.8 | |
| Labour | Beck Hemsley | 165 | 9.6 | −8.9 | |
| Brexit Party | Richard Hartland | 163 | 9.5 | +9.5 | |
| Green | Becca Stevenson | 79 | 4.6 | +4.6 | |
| Majority | 617 | 36.0 | |||
| Turnout | 1,716 | ||||
| Liberal Democrats hold | Swing | ||||
| Party | Candidate | Votes | % | ±% | |
|---|---|---|---|---|---|
| Conservative | Becky Maoudis | 370 | 76.6 | +1.6 | |
| Labour | Richard Harrington | 60 | 12.4 | −12.6 | |
| Liberal Democrats | Sam Edwards | 29 | 6.0 | +6.0 | |
| Green | Mark Summers | 24 | 5.0 | +5.0 | |
| Majority | 310 | 64.2 | |||
| Turnout | 483 | ||||
| Conservative hold | Swing | ||||
2022–2026
| Party | Candidate | Votes | % | ±% | |
|---|---|---|---|---|---|
| Liberal Democrats | Jonathan Bennett | 613 | |||
| Conservative | Jill Simpson-Vince | 588 | |||
| Conservative | Salome Eric | 557 | |||
| Liberal Democrats | Trisha Trimble | 548 | |||
| Labour | Stephen Dyke | 299 | |||
| Labour | Jenny Offordile | 256 | |||
| Green | Helen Ford | 145 | |||
| Green | Mark Summers | 89 | |||
| Liberal Democrats gain from Conservative | Swing | ||||
| Conservative hold | Swing | ||||
References
- ^ a b "The Rugby (Electoral Changes) Order 2012", legislation.gov.uk, The National Archives, SI 2012/4, retrieved 8 September 2022
- ^ legislation.gov.uk – The Borough of Rugby (Electoral Arrangements) Order 1978. Retrieved on 19 November 2015.
- ^ legislation.gov.uk – The Northamptonshire and Warwickshire (County Boundaries) Order 1988. Retrieved on 5 November 2015.
- ^ legislation.gov.uk – The Warwickshire and West Midlands (County and District Boundaries) Order 1993. Retrieved on 5 November 2015.
- ^ legislation.gov.uk – The Borough of Rugby (Electoral Changes) Order 2000. Retrieved on 4 October 2015.
- ^ legislation.gov.uk – The Borough of Rugby (Electoral Changes) (No.2) Order 2000. Retrieved on 4 October 2015.
- ^ legislation.gov.uk – The Rugby (Parish Electoral Arrangements and Electoral Changes) Order 2007. Retrieved on 3 November 2015.
- ^ "The Rugby (Electoral Changes) Order 2015", legislation.gov.uk, The National Archives, SI 2015/120, retrieved 8 September 2022
- ^ "Local Elections Archive Project — Avon and Swift Ward". www.andrewteale.me.uk. Retrieved 28 February 2024.
- ^ "Local Elections Archive Project — Dunchurch and Knightlow Ward". www.andrewteale.me.uk. Retrieved 28 February 2024.
- ^ "Local Elections Archive Project — New Bilton Ward". www.andrewteale.me.uk. Retrieved 28 February 2024.
- ^ "Local Elections Archive Project — Bilton Ward". www.andrewteale.me.uk. Retrieved 28 February 2024.
- ^ "Local Elections Archive Project — Hillmorton Ward". www.andrewteale.me.uk. Retrieved 28 February 2024.
- ^ "Local Elections Archive Project — Bilton Ward". www.andrewteale.me.uk. Retrieved 28 February 2024.
- ^ "Local Elections Archive Project — Coton and Boughton Ward". www.andrewteale.me.uk. Retrieved 28 February 2024.
- ^ "Local Elections Archive Project — New Bilton Ward". www.andrewteale.me.uk. Retrieved 28 February 2024.
- ^ "Local Elections Archive Project — Rokeby and Overslade Ward". www.andrewteale.me.uk. Retrieved 28 February 2024.
- ^ "Local Elections Archive Project — Wolvey and Shilton Ward". www.andrewteale.me.uk. Retrieved 28 February 2024.
- ^ "Local Elections Archive Project — Dunsmore Ward". www.andrewteale.me.uk. Retrieved 28 February 2024.