Stratford-on-Avon District Council elections
Stratford-on-Avon District Council elections are held every four years. Stratford-on-Avon District Council is the local authority for the non-metropolitan district of Stratford-on-Avon in Warwickshire, England. Since the last boundary changes in 2023, 41 councillors have been elected from 39 wards.[1] Prior to 2015 elections were held three years out of every four, with a third of the council elected each time.
Council elections
- 1973 Stratford-on-Avon District Council election
- 1976 Stratford-on-Avon District Council election
- 1979 Stratford-on-Avon District Council election (New ward boundaries)[2]
- 1980 Stratford-on-Avon District Council election
- 1982 Stratford-on-Avon District Council election
- 1983 Stratford-on-Avon District Council election
- 1984 Stratford-on-Avon District Council election
- 1986 Stratford-on-Avon District Council election
- 1987 Stratford-on-Avon District Council election
- 1988 Stratford-on-Avon District Council election
- 1990 Stratford-on-Avon District Council election
- 1991 Stratford-on-Avon District Council election
- 1992 Stratford-on-Avon District Council election
- 1994 Stratford-on-Avon District Council election (District boundary changes took place but the number of seats remained the same)[3][4]
- 1995 Stratford-on-Avon District Council election
- 1996 Stratford-on-Avon District Council election
- 1998 Stratford-on-Avon District Council election
- 1999 Stratford-on-Avon District Council election
- 2000 Stratford-on-Avon District Council election
- 2002 Stratford-on-Avon District Council election (New ward boundaries reduced the number of seats by 2)[5][6]
- 2003 Stratford-on-Avon District Council election
- 2004 Stratford-on-Avon District Council election
- 2006 Stratford-on-Avon District Council election
- 2007 Stratford-on-Avon District Council election
- 2008 Stratford-on-Avon District Council election (Some new ward boundaries)[7]
- 2010 Stratford-on-Avon District Council election
- 2011 Stratford-on-Avon District Council election
- 2012 Stratford-on-Avon District Council election
- 2014 Stratford-on-Avon District Council election
- 2015 Stratford-on-Avon District Council election (New ward boundaries)[8]
- 2019 Stratford-on-Avon District Council election
- 2023 Stratford-on-Avon District Council election (New ward boundaries)[1]
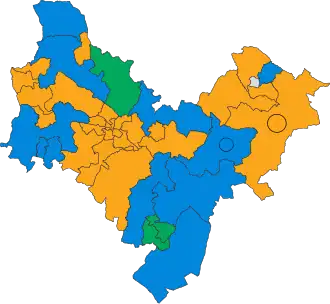
District result maps
-
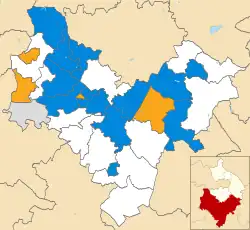
 2002 results map
 -
 2003 results map
 -
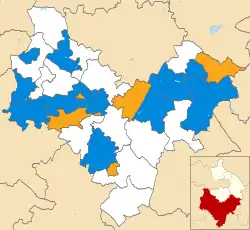
 2004 results map
 -
 2006 results map
 -
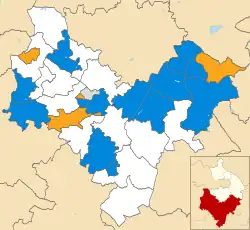
 2007 results map
 -
 2008 results map
 -
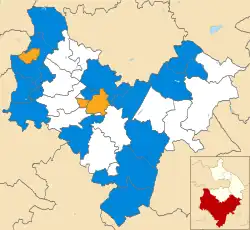
 2010 results map
 -
 2011 results map
 -
 2012 results map
 -
 2014 results map
 -
 2015 results map
 -
 2019 results map
 -
 2023 results map
By-election results
1994-1998
| Party | Candidate | Votes | % | ±% | |
|---|---|---|---|---|---|
| Conservative | 277 | 67.7 | |||
| Liberal Democrats | 132 | 32.4 | |||
| Majority | 145 | 35.3 | |||
| Turnout | 409 | 32.0 | |||
| Conservative hold | Swing | ||||
| Party | Candidate | Votes | % | ±% | |
|---|---|---|---|---|---|
| Independent | 266 | 56.5 | |||
| Conservative | 167 | 35.4 | |||
| Labour | 38 | 8.0 | |||
| Majority | 99 | 21.1 | |||
| Turnout | 471 | 35.3 | |||
| Independent hold | Swing | ||||
1998-2002
| Party | Candidate | Votes | % | ±% | |
|---|---|---|---|---|---|
| Conservative | 441 | 58.9 | +7.3 | ||
| Liberal Democrats | 308 | 41.1 | −7.3 | ||
| Majority | 133 | 17.8 | |||
| Turnout | 749 | 37.0 | |||
| Conservative hold | Swing | ||||
| Party | Candidate | Votes | % | ±% | |
|---|---|---|---|---|---|
| Liberal Democrats | 306 | 67.3 | |||
| Independent | 149 | 32.7 | |||
| Majority | 157 | 34.6 | |||
| Turnout | 455 | ||||
| Liberal Democrats hold | Swing | ||||
| Party | Candidate | Votes | % | ±% | |
|---|---|---|---|---|---|
| Liberal Democrats | Darren Pemberton | 449 | 48.4 | +48.4 | |
| Conservative | Graham Getgood | 405 | 43.7 | −7.4 | |
| Labour | Michael Gerard | 73 | 7.9 | −3.7 | |
| Majority | 44 | 4.7 | |||
| Turnout | 927 | ||||
| Liberal Democrats gain from Independent | Swing | ||||
| Party | Candidate | Votes | % | ±% | |
|---|---|---|---|---|---|
| Conservative | Richard Adams | 313 | 55.5 | −10.8 | |
| Liberal Democrats | Virginia Mason | 228 | 40.4 | +6.7 | |
| Labour | Jacqueline Abbott | 23 | 4.1 | +4.1 | |
| Majority | 85 | 15.1 | |||
| Turnout | 564 | 40.2 | |||
| Conservative hold | Swing | ||||
2002-2006
| Party | Candidate | Votes | % | ±% | |
|---|---|---|---|---|---|
| Conservative | Gillian Roche | 469 | 48.8 | −23.9 | |
| Liberal Democrats | 391 | 40.6 | +13.3 | ||
| Independent | 73 | 7.6 | +7.6 | ||
| Green | 29 | 3.0 | +3.0 | ||
| Majority | 78 | 8.2 | |||
| Turnout | 962 | 53.1 | |||
| Conservative hold | Swing | ||||
| Party | Candidate | Votes | % | ±% | |
|---|---|---|---|---|---|
| Liberal Democrats | 727 | 48.6 | +5.5 | ||
| Conservative | 489 | 32.7 | −24.2 | ||
| Independent | 281 | 18.7 | +18.7 | ||
| Majority | 238 | 15.9 | |||
| Turnout | 1,497 | 35.3 | |||
| Liberal Democrats gain from Conservative | Swing | ||||
| Party | Candidate | Votes | % | ±% | |
|---|---|---|---|---|---|
| Conservative | Stephen Gray | 706 | 57.4 | ||
| Liberal Democrats | Virginia Mason | 523 | 42.6 | ||
| Majority | 283 | 14.8 | |||
| Turnout | 1,229 | 73.2 | |||
| Conservative hold | Swing | ||||
2006-2010
| Party | Candidate | Votes | % | ±% | |
|---|---|---|---|---|---|
| Conservative | Laura Main | 897 | 47.2 | ||
| Liberal Democrats | Priscilla Cook | 804 | 42.4 | ||
| Labour | John Ritchie | 197 | 10.4 | ||
| Majority | 93 | 4.8 | |||
| Turnout | 1,898 | 35.9 | |||
| Conservative hold | Swing | ||||
| Party | Candidate | Votes | % | ±% | |
|---|---|---|---|---|---|
| Conservative | Susan Adams | 798 | 53.5 | +22.4 | |
| Liberal Democrats | Karyl Rees | 638 | 42.8 | −13.9 | |
| Labour | Matthew Stephens | 54 | 3.6 | −2.0 | |
| Majority | 160 | 10.7 | |||
| Turnout | 1,490 | 31.8 | |||
| Conservative gain from Liberal Democrats | Swing | ||||
| Party | Candidate | Votes | % | ±% | |
|---|---|---|---|---|---|
| Conservative | Susan Wixey | 712 | 54.4 | +13.3 | |
| Liberal Democrats | Sandra Knapton | 598 | 45.6 | −13.3 | |
| Majority | 114 | 8.8 | |||
| Turnout | 1,310 | 39.4 | |||
| Conservative gain from Liberal Democrats | Swing | ||||
| Party | Candidate | Votes | % | ±% | |
|---|---|---|---|---|---|
| Liberal Democrats | Anthony Cronin | 888 | 47.0 | −2.1 | |
| Conservative | Lynda Organ | 834 | 44.1 | +1.8 | |
| Labour | David Talbot | 111 | 5.9 | +5.9 | |
| Green | Hugh Chatwin | 58 | 3.1 | +3.1 | |
| Majority | 54 | 2.9 | |||
| Turnout | 1,891 | 31.2 | |||
| Liberal Democrats gain from Conservative | Swing | ||||
2011-2015
| Party | Candidate | Votes | % | ±% | |
|---|---|---|---|---|---|
| Labour | Jeffrey Kenner | 613 | 37.9 | +9.1 | |
| Liberal Democrats | Laura Nelson | 575 | 35.5 | −7.8 | |
| Conservative | Marion Lowe | 431 | 26.6 | +2.2 | |
| Majority | 38 | 2.3 | |||
| Turnout | 1,619 | ||||
| Labour gain from Conservative | Swing | ||||
| Party | Candidate | Votes | % | ±% | |
|---|---|---|---|---|---|
| Conservative | Tony Bromwich | 493 | 42.9 | +2.0 | |
| Labour | Bransby Thomas | 398 | 34.6 | +11.7 | |
| UKIP | Emily Bleloch | 259 | 22.5 | −7.0 | |
| Majority | 95 | 8.3 | |||
| Turnout | 1,150 | ||||
| Conservative hold | Swing | ||||
2015-2019
| Party | Candidate | Votes | % | ±% | |
|---|---|---|---|---|---|
| Liberal Democrats | Hazel Wright | 632 | 55.3 | +24.1 | |
| Conservative | Paul Beaman | 233 | 20.4 | −12.2 | |
| Labour | Karen Somner-Brown | 156 | 13.7 | +4.5 | |
| Independent | Nick Moon | 66 | 5.8 | N/A | |
| UKIP | Nigel Rogers | 55 | 4.8 | −5.5 | |
| Majority | 376 | 34.9 | |||
| Turnout | 39.5 | ||||
| Liberal Democrats gain from Conservative | Swing | ||||
The by-election was caused by the resignation of Councillor Nick Moon, who was elected as a Conservative. However, Moon changed his mind and contested the election as an Independent, receiving 5.8% of the vote[20]
| Party | Candidate | Votes | % | ±% | |
|---|---|---|---|---|---|
| Conservative | John Feilding | 476 | 53.4 | −9.0 | |
| Liberal Democrats | Philip Vial | 266 | 29.8 | +20.2 | |
| UKIP | Edward Fila | 92 | 10.3 | −4.9 | |
| Green | Pat Hotson | 58 | 6.5 | +6.5 | |
| Majority | 210 | 23.5 | |||
| Turnout | 892 | ||||
| Conservative hold | Swing | ||||
| Party | Candidate | Votes | % | ±% | |
|---|---|---|---|---|---|
| Conservative | Penny-Anne O'Donnell | 949 | 74.3 | +9.0 | |
| Liberal Democrats | Bill Dowling | 227 | 17.8 | +6.4 | |
| Green | Dave Passingham | 102 | 8.0 | +2.7 | |
| Majority | 722 | 56.5 | |||
| Turnout | 1,278 | ||||
| Conservative hold | Swing | ||||
2019-2023
| Party | Candidate | Votes | % | ±% | |
|---|---|---|---|---|---|
| Liberal Democrats | Manuela Perteghella | 472 | 43.6 | +43.6 | |
| Conservative | Richard Cox | 323 | 29.9 | +8.8 | |
| Independent | Neal Appleton | 231 | 21.3 | +21.3 | |
| Labour | Anthony Kent | 41 | 3.8 | −1.5 | |
| Green | John Stott | 15 | 1.4 | −7.1 | |
| Majority | 149 | 13.8 | |||
| Turnout | 1,082 | ||||
| Liberal Democrats gain from Independent | Swing | ||||
2023-2025
| Party | Candidate | Votes | % | ±% | |
|---|---|---|---|---|---|
| Liberal Democrats | Cliff Brown | 485 | 45.5 | −28.0 | |
| Reform UK | Neil Lawrence | 330 | 31.0 | +31.0 | |
| Conservative | Christian Reeve | 190 | 17.8 | −3.4 | |
| Labour | John Hartigan | 41 | 3.8 | +0.6 | |
| Green | Penny Stott | 32 | 3.0 | +0.9 | |
| Majority | 155 | 14.5 | −37.8 | ||
| Turnout | 1,069 | 41.05 | −8.25 | ||
| Liberal Democrats hold | Swing | ||||
| Party | Candidate | Votes | % | ±% | |
|---|---|---|---|---|---|
| Liberal Democrats | Tom Ballinger | 403 | 32.9 | −7.6 | |
| Reform UK | Ashley Jones | 278 | 22.7 | +22.7 | |
| Conservative | Emma Daniell | 265 | 21.7 | −4.5 | |
| Labour | Andrew Foster | 241 | 19.7 | −11.0 | |
| Green | John Stott | 37 | 3.0 | +0.4 | |
| Majority | 125 | 10.2 | +0.4 | ||
| Turnout | 1,224 | 44.75 | −1.75 | ||
| Liberal Democrats hold | Swing | ||||
References
- ^ a b "The Stratford-on-Avon (Electoral Changes) Order 2022", legislation.gov.uk, The National Archives, SI 2022/1137, retrieved 22 January 2024
- ^ The District of Stratford-on-Avon (Electoral Arrangements) Order 1977
- ^ "The Hereford and Worcester and Warwickshire (County Boundaries) Order 1993", legislation.gov.uk, The National Archives, SI 1993/272, retrieved 8 September 2022
- ^ "The Hereford and Worcester, Warwickshire and West Midlands (County and Metropolitan Borough Boundaries) Order 1993", legislation.gov.uk, The National Archives, SI 1993/437, retrieved 8 September 2022
- ^ "Stratford-on-Avon". BBC News Online. Retrieved 17 September 2009.
- ^ "The District of Stratford-on-Avon (Electoral Changes) Order 2000", legislation.gov.uk, The National Archives, SI 2000/2059, retrieved 8 September 2022
- ^ "The Stratford-on-Avon (Parish Electoral Arrangements and Electoral Changes) Order 2008", legislation.gov.uk, The National Archives, SI 2008/748, retrieved 8 September 2022
- ^ "The Stratford-on-Avon (Electoral Changes) Order 2014", legislation.gov.uk, The National Archives, SI 2014/3057, retrieved 8 September 2022
- ^ a b "Council election win for LibDem party". Coventry Evening Telegraph. 18 September 2001. p. 5.
- ^ "Tories make shock gain from SNP". guardian.co.uk. London. 20 September 2002. Retrieved 17 September 2009.
- ^ "Tories slump after leadership row". guardian.co.uk. London. 8 November 2002. Retrieved 17 September 2009.
- ^ "Election Details and Results". Stratford-on-Avon District Council. Archived from the original on 26 February 2010. Retrieved 17 September 2009.
- ^ "Wellesbourne Elections". Stratford-on-Avon District Council. Archived from the original on 3 November 2009. Retrieved 17 September 2009.
- ^ "August 2006 Alcester by-election". Stratford-on-Avon District Council. Archived from the original on 3 November 2009. Retrieved 17 September 2009.
- ^ "November 2006 - Kineton by-election". Stratford-on-Avon District Council. Archived from the original on 5 November 2009. Retrieved 17 September 2009.
- ^ "Lib Dems win both seats in Alveston by-election". Stratford Herald. 26 November 2009. Archived from the original on 16 July 2011. Retrieved 27 November 2009.
- ^ "Local Elections Archive Project — Shipston Ward". www.andrewteale.me.uk. Retrieved 5 March 2024.
- ^ "Local Elections Archive Project — Southam Ward". www.andrewteale.me.uk. Retrieved 5 March 2024.
- ^ "Lib dem Hazel Wright wins Studley with Sambourne by-election".
- ^ "Studley with Sambourne District by-election takes place this Thursday". 24 February 2016.
- ^ "Local Elections Archive Project — Red Horse Ward". www.andrewteale.me.uk. Retrieved 5 March 2024.
- ^ "Local Elections Archive Project — Ettington Ward". www.andrewteale.me.uk. Retrieved 5 March 2024.
- ^ "Local Elections Archive Project — Welford-on-Avon Ward". www.andrewteale.me.uk. Retrieved 5 March 2024.
- ^ "Local Elections Archive Project — Welford-on-Avon Ward". www.andrewteale.me.uk. Retrieved 6 May 2025.
- ^ "Local Elections Archive Project — Alcester West Ward". www.andrewteale.me.uk. Retrieved 6 May 2025.