Southeast Anatolia region (statistical)
Southeast Anatolia Region
Güneydoğu Anadolu Bölgesi | |
|---|---|
Region | |
 | |
| Country | Turkey |
| Area | |
• Region | 76,192 km2 (29,418 sq mi) |
| Population (2024) | |
• Region | 9,490,286[1] |
| • Rank | 4th |
| • Urban | 8,872,957 |
| • Rural | 617,329 |
| HDI (2022) | 0.805[2] very high · 11th |
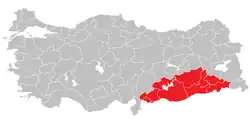
The Southeast Anatolia Region (Turkish: Güneydoğu Anadolu Bölgesi) (TRC) is a statistical region in Turkey.
Subregions and provinces
- Gaziantep Subregion (TRC1)
- Gaziantep Province (TRC11)
- Adıyaman Province (TRC12)
- Kilis Province (TRC13)
- Şanlıurfa Subregion (TRC2)
- Şanlıurfa Province (TRC21)
- Diyarbakır Province (TRC22)
- Mardin Subregion (TRC3)
- Mardin Province (TRC31)
- Batman Province (TRC32)
- Şırnak Province (TRC33)
- Siirt Province (TRC34)
Population
| Year | Pop. | ±% p.a. |
|---|---|---|
| 2007 | 7,170,849 | — |
| 2008 | 7,350,752 | +2.51% |
| 2009 | 7,462,893 | +1.53% |
| 2010 | 7,592,772 | +1.74% |
| 2011 | 7,816,173 | +2.94% |
| 2012 | 7,958,473 | +1.82% |
| 2013 | 8,096,352 | +1.73% |
| 2014 | 8,250,718 | +1.91% |
| 2015 | 8,385,540 | +1.63% |
| 2016 | 8,508,887 | +1.47% |
| 2017 | 8,665,165 | +1.84% |
| 2018 | 8,847,980 | +2.11% |
| 2019 | 8,975,618 | +1.44% |
| 2020 | 9,118,921 | +1.60% |
| 2021 | 9,210,440 | +1.00% |
| 2022 | 9,305,910 | +1.04% |
| 2023 | 9,410,624 | +1.13% |
| 2024 | 9,490,286 | +0.85% |
Structure of the population
Structure of the population
Structure of the population (31.12.2024):
| Age group | Male | Female | Total | Percent |
|---|---|---|---|---|
| Total | 4,801,878 | 4,688,408 | 9,490,286 | 100 |
| 0–4 | 480,382 | 457,571 | 937,953 | 9.88 |
| 5–9 | 543,454 | 518,761 | 1,062,215 | 11.19 |
| 10–14 | 520,149 | 496,757 | 1,016,906 | 10.72 |
| 15–19 | 475,748 | 451,040 | 926,788 | 9.77 |
| 20–24 | 400,951 | 378,672 | 779,623 | 8.21 |
| 25–29 | 408,992 | 402,184 | 811,176 | 8.55 |
| 30–34 | 379,298 | 363,008 | 742,306 | 7.82 |
| 35–39 | 329,620 | 314,669 | 644,289 | 6.79 |
| 40–44 | 294,799 | 286,900 | 581,699 | 6.13 |
| 45–49 | 239,765 | 235,212 | 474,977 | 5.00 |
| 50–54 | 206,758 | 203,960 | 410,718 | 4.33 |
| 55–59 | 158,532 | 150,527 | 309,059 | 3.26 |
| 60–64 | 133,186 | 133,461 | 266,647 | 2.81 |
| 65–69 | 90,276 | 95,810 | 186,086 | 1.96 |
| 70–74 | 64,252 | 77,001 | 141,253 | 1.49 |
| 75–79 | 40,462 | 57,974 | 98,436 | 1.04 |
| 80–84 | 21,258 | 33,171 | 54,429 | 0.57 |
| 85–89 | 9,329 | 18,583 | 27,912 | 0.29 |
| 90+ | 4,667 | 13,147 | 17,814 | 0.19 |
| Age group | Male | Female | Total | Percent |
|---|---|---|---|---|
| 0–14 | 1,543,985 | 1,473,089 | 3,017,074 | 31.79 |
| 15–64 | 3,027,649 | 2,919,633 | 5,947,282 | 62.67 |
| 65+ | 230,244 | 295,686 | 525,930 | 5.54 |
Internal immigration
| Region | Population | Immigrants | Emigrants | Net immigrants | Net immigration rate |
|---|---|---|---|---|---|
| Southeast Anatolia | 9,490,286 | 177,574 | 223,513 | -45,939 | -4.83 |
State register location of Southeast Anatolia residents
| Region | Population | Percentage |
|---|---|---|
| Istanbul | 4,754 | 0.1 |
| West Marmara | 8,861 | 0.1 |
| Aegean | 28,224 | 0.3 |
| East Marmara | 12,286 | 0.1 |
| West Anatolia | 20,850 | 0.3 |
| Mediterranean | 181,874 | 2.2 |
| Central Anatolia | 36,818 | 0.4 |
| West Black Sea | 27,735 | 0.3 |
| East Black Sea | 13,140 | 0.2 |
| Northeast Anatolia | 20,576 | 0.3 |
| Central East Anatolia | 133,862 | 1.6 |
| Southeast Anatolia | 7,738,941 | 94.1 |
| Total | 8,227,921 | 100 |
Marital status of 15+ population by gender
| Gender | Never married | % | Married | % | Divorced | % | Spouse died | % | Total |
|---|---|---|---|---|---|---|---|---|---|
| Male | 1,248,222 | 38.3 | 1,916,136 | 58.8 | 58,323 | 1.8 | 35,212 | 1.1 | 3,257,893 |
| Female | 1,019,260 | 31.7 | 1,910,635 | 59.4 | 79,160 | 2.5 | 206,264 | 6.4 | 3,215,319 |
| Total | 2,267,482 | 35.0 | 3,826,771 | 59.1 | 137,483 | 2.1 | 241,476 | 3.7 | 6,473,212 |
Education status of 15+ population by gender
| Gender | Illiterate | % | Literate with no diploma | % | Primary school | % | Primary education | % | Middle school | % | High school | % | College or university | % | Master's degree | % | Doctorate | % | Unknown | % | Total |
|---|---|---|---|---|---|---|---|---|---|---|---|---|---|---|---|---|---|---|---|---|---|
| Male | 43,496 | 1.3 | 89,170 | 2.7 | 357,498 | 11.0 | 306,715 | 9.5 | 916,775 | 28.2 | 955,201 | 29.4 | 487,760 | 15.0 | 66,251 | 2.0 | 7,298 | 0.2 | 15,075 | 0.5 | 3,245,239 |
| Female | 312,932 | 9.8 | 281,759 | 8.8 | 516,134 | 16.1 | 199,008 | 6.2 | 765,909 | 23.9 | 657,981 | 20.5 | 407,523 | 12.7 | 39,290 | 1.2 | 3,597 | 0.1 | 18,941 | 0.6 | 3,203,074 |
| All genders | 356,428 | 5.5 | 370,929 | 5.8 | 873,632 | 13.5 | 505,723 | 7.8 | 1,682,684 | 26.1 | 1,613,182 | 25.0 | 895,283 | 13.9 | 105,541 | 1.6 | 10,895 | 0.2 | 34,016 | 0.5 | 6,448,313 |
See also
References
- ^ "medas".
- ^ "Sub-national HDI - Area Database - Global Data Lab". hdi.globaldatalab.org. Retrieved 2018-09-13.
- ^ TurkStat "Archived copy". Archived from the original on 2015-07-16. Retrieved 2015-08-27.
{{cite web}}: CS1 maint: archived copy as title (link) - ^ TurkStat
- ^ TurkStat "Archived copy". Archived from the original on 2015-07-21. Retrieved 2015-07-21.
{{cite web}}: CS1 maint: archived copy as title (link) - ^ TurkStat "Archived copy". Archived from the original on 2015-07-21. Retrieved 2015-07-21.
{{cite web}}: CS1 maint: archived copy as title (link)
External links
- TURKSTAT (in English)
Sources