1872 Manchester City Council election
| ||||||||||||||||||||||||||||
16 of 64 seats to Manchester City Council 33 seats needed for a majority | ||||||||||||||||||||||||||||
|---|---|---|---|---|---|---|---|---|---|---|---|---|---|---|---|---|---|---|---|---|---|---|---|---|---|---|---|---|
| ||||||||||||||||||||||||||||
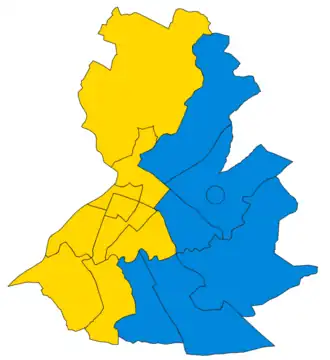 Map of results of 1872 election | ||||||||||||||||||||||||||||
| ||||||||||||||||||||||||||||
Elections to Manchester City Council were held on Friday, 1 November 1872. One third of the councillors seats were up for election, with each successful candidate to serve a three-year term of office. The Liberal Party retained overall control of the council.[1][2]
Election result
| Party | Votes | Seats | Full Council | |||||||
| Liberal Party | 13,625 (45.0%) | 9 (56.2%) | 9 / 16
|
36 (56.2%) | 36 / 64
| |||||
| Conservative Party | 16,644 (55.0%) | 7 (43.8%) | 7 / 16
|
28 (43.8%) | 28 / 64
| |||||
Full council
| 36 | 28 |
Aldermen
| 11 | 5 |
Councillors
| 25 | 23 |
Ward results
All Saints'
| Party | Candidate | Votes | % | ±% | |
|---|---|---|---|---|---|
| Conservative | T. Potts | 806 | 50.8 | ||
| Liberal | T. Clowes* | 782 | 49.2 | ||
| Majority | 24 | 1.6 | |||
| Turnout | 1,588 | ||||
| Conservative gain from Liberal | Swing | ||||
Ardwick
| Party | Candidate | Votes | % | ±% | |
|---|---|---|---|---|---|
| Conservative | R. Whittaker* | 1,672 | 61.1 | ||
| Liberal | H. Shaw | 1,066 | 38.9 | ||
| Majority | 606 | 22.2 | |||
| Turnout | 2,738 | ||||
| Conservative hold | Swing | ||||
Cheetham
| Party | Candidate | Votes | % | ±% | |
|---|---|---|---|---|---|
| Liberal | J. J. Harwood* | 751 | 85.4 | ||
| Conservative | R. Bower | 128 | 14.6 | ||
| Majority | 623 | 70.8 | |||
| Turnout | 879 | ||||
| Liberal hold | Swing | ||||
Collegiate Church
| Party | Candidate | Votes | % | ±% | |
|---|---|---|---|---|---|
| Liberal | T. Worthington* | 902 | 56.0 | ||
| Conservative | R. Simister | 709 | 44.0 | ||
| Majority | 193 | 12.0 | |||
| Turnout | 1,611 | ||||
| Liberal hold | Swing | ||||
Exchange
| Party | Candidate | Votes | % | ±% | |
|---|---|---|---|---|---|
| Liberal | T. Warburton* | 471 | 65.3 | ||
| Conservative | T. Dale | 250 | 34.7 | ||
| Majority | 221 | 30.6 | |||
| Turnout | 721 | ||||
| Liberal hold | Swing | ||||
Medlock Street
| Party | Candidate | Votes | % | ±% | |
|---|---|---|---|---|---|
| Liberal | M. Price | 1,430 | 50.1 | ||
| Conservative | G. Cunningham* | 1,424 | 49.9 | ||
| Majority | 6 | 0.2 | |||
| Turnout | 2,854 | ||||
| Liberal gain from Conservative | Swing | ||||
New Cross
| Party | Candidate | Votes | % | ±% | |
|---|---|---|---|---|---|
| Conservative | A. Woodward* | 2,982 | 54.7 | ||
| Conservative | W. G. Bennett | 2,742 | 50.3 | ||
| Liberal | C. Stewart* | 2,586 | 47.5 | ||
| Majority | 156 | 2.8 | |||
| Turnout | 5,448 | ||||
| Conservative hold | Swing | ||||
| Conservative gain from Liberal | Swing | ||||
Oxford
| Party | Candidate | Votes | % | ±% | |
|---|---|---|---|---|---|
| Liberal | J. F. Roberts* | 537 | 52.6 | ||
| Conservative | J. Henstock | 484 | 47.4 | ||
| Majority | 53 | 5.2 | |||
| Turnout | 1,021 | ||||
| Liberal hold | Swing | ||||
St. Ann's
| Party | Candidate | Votes | % | ±% | |
|---|---|---|---|---|---|
| Liberal | T. Baker* | 476 | 70.0 | ||
| Conservative | J. E. Middlehurst | 204 | 30.0 | ||
| Majority | 272 | 40.0 | |||
| Turnout | 680 | ||||
| Liberal hold | Swing | ||||
St. Clement's
| Party | Candidate | Votes | % | ±% | |
|---|---|---|---|---|---|
| Conservative | G. Anderton* | 1,132 | 64.6 | ||
| Liberal | E. Asquith | 621 | 35.4 | ||
| Majority | 511 | 29.2 | |||
| Turnout | 1,753 | ||||
| Conservative hold | Swing | ||||
St. George's
| Party | Candidate | Votes | % | ±% | |
|---|---|---|---|---|---|
| Liberal | T. Schofield* | uncontested | |||
| Liberal hold | Swing | ||||
St. James'
| Party | Candidate | Votes | % | ±% | |
|---|---|---|---|---|---|
| Liberal | J. Waterhouse* | uncontested | |||
| Liberal hold | Swing | ||||
St. John's
| Party | Candidate | Votes | % | ±% | |
|---|---|---|---|---|---|
| Liberal | J. Sawley Brown | 799 | 56.1 | ||
| Conservative | W. Livesley* | 626 | 43.9 | ||
| Majority | 173 | 12.2 | |||
| Turnout | 1,425 | ||||
| Liberal gain from Conservative | Swing | ||||
St. Luke's
| Party | Candidate | Votes | % | ±% | |
|---|---|---|---|---|---|
| Conservative | C. W. May | 951 | 51.8 | ||
| Liberal | J. Duncan* | 886 | 48.2 | ||
| Majority | 65 | 3.6 | |||
| Turnout | 1,837 | ||||
| Conservative gain from Liberal | Swing | ||||
St. Michael's
| Party | Candidate | Votes | % | ±% | |
|---|---|---|---|---|---|
| Conservative | R. T. Walker* | 2,534 | 52.2 | ||
| Liberal | W. Cliff | 2,318 | 47.8 | ||
| Majority | 216 | 4.4 | |||
| Turnout | 4,852 | ||||
| Conservative hold | Swing | ||||