1920 Salford Borough Council election
| ||||||||||||||||||||||||||||||||||||||||||||||||||||||||||||||||||||||||||||||||||
16 of 64 seats on Salford County Borough Council 33 seats needed for a majority | ||||||||||||||||||||||||||||||||||||||||||||||||||||||||||||||||||||||||||||||||||
|---|---|---|---|---|---|---|---|---|---|---|---|---|---|---|---|---|---|---|---|---|---|---|---|---|---|---|---|---|---|---|---|---|---|---|---|---|---|---|---|---|---|---|---|---|---|---|---|---|---|---|---|---|---|---|---|---|---|---|---|---|---|---|---|---|---|---|---|---|---|---|---|---|---|---|---|---|---|---|---|---|---|---|
| ||||||||||||||||||||||||||||||||||||||||||||||||||||||||||||||||||||||||||||||||||
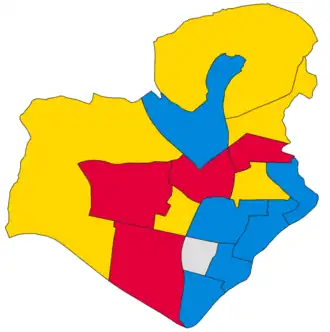 Map of results of 1920 election | ||||||||||||||||||||||||||||||||||||||||||||||||||||||||||||||||||||||||||||||||||
| ||||||||||||||||||||||||||||||||||||||||||||||||||||||||||||||||||||||||||||||||||
Elections to Salford Borough Council were held on Monday, 1 November 1920. One third of the councillors seats were up for election, with each successful candidate to serve a three-year term of office. The council remained under no overall control.[1][2]
Election result
| Party | Votes | Seats | Full Council | |||||||
| Conservative Party | 11,541 (32.6%) | 6 (37.5%) | 6 / 16
|
28 (43.8%) | 28 / 64
| |||||
| Liberal Party | 6,121 (17.3%) | 5 (31.3%) | 5 / 16
|
21 (32.8%) | 21 / 64
| |||||
| Labour Party | 15,940 (45.1%) | 4 (25.0%) | 4 / 16
|
13 (20.3%) | 13 / 64
| |||||
| Independent | 1,768 (5.0%) | 1 (6.3%) | 1 / 16
|
2 (3.1%) | 2 / 64
| |||||
Full council
| 13 | 21 | 2 | 28 |
Ward results
Albert Park
| Party | Candidate | Votes | % | ±% | |
|---|---|---|---|---|---|
| Liberal | J. E. Collins* | uncontested | |||
| Liberal hold | Swing | ||||
Charlestown
| Party | Candidate | Votes | % | ±% | |
|---|---|---|---|---|---|
| Conservative | W. Crossley | 1,516 | 48.4 | N/A | |
| Labour | J. J. Richardson* | 1,441 | 46.1 | N/A | |
| Independent | J. W. Oxley | 172 | 5.5 | N/A | |
| Majority | 75 | 2.3 | |||
| Turnout | 3,129 | 78.4 | +21.5 | ||
| Conservative gain from Labour | Swing | ||||
Crescent
| Party | Candidate | Votes | % | ±% | |
|---|---|---|---|---|---|
| Conservative | S. H. Kettle* | 1,226 | 54.5 | −9.4 | |
| Labour | F. McHale | 1,023 | 45.5 | N/A | |
| Majority | 203 | 9.0 | −18.8 | ||
| Turnout | 2,249 | 56.9 | +8.6 | ||
| Conservative hold | Swing | ||||
Grosvenor
| Party | Candidate | Votes | % | ±% | |
|---|---|---|---|---|---|
| Labour | A. Atherton | 1,532 | 59.6 | N/A | |
| Conservative | G. Fernehough | 650 | 25.3 | −31.8 | |
| Independent | J. Maguire | 389 | 15.1 | N/A | |
| Majority | 882 | 34.3 | |||
| Turnout | 2,571 | 55.6 | +9.0 | ||
| Labour gain from Conservative | Swing | ||||
Hope
| Party | Candidate | Votes | % | ±% | |
|---|---|---|---|---|---|
| Liberal | A. H. Collins* | 2,790 | 62.1 | N/A | |
| Labour | J. Shorten | 1,704 | 37.9 | N/A | |
| Majority | 1,086 | 24.2 | N/A | ||
| Turnout | 4,494 | 51.5 | N/A | ||
| Liberal hold | Swing | ||||
Islington
| Party | Candidate | Votes | % | ±% | |
|---|---|---|---|---|---|
| Conservative | W. S. Roberts | 1,055 | 59.1 | +14.0 | |
| Labour | T. Neavsey | 667 | 37.4 | −17.5 | |
| Independent | J. T. Wicks | 63 | 3.5 | N/A | |
| Majority | 388 | 21.7 | |||
| Turnout | 1,785 | 60.5 | +7.2 | ||
| Conservative hold | Swing | ||||
Kersal
| Party | Candidate | Votes | % | ±% | |
|---|---|---|---|---|---|
| Liberal | W. P. Burnley* | uncontested | |||
| Liberal hold | Swing | ||||
Ordsall
| Party | Candidate | Votes | % | ±% | |
|---|---|---|---|---|---|
| Conservative | F. Hampson | 1,872 | 58.3 | +19.6 | |
| Labour | J. Baker* | 1,340 | 41.7 | −19.6 | |
| Majority | 532 | 16.6 | |||
| Turnout | 3,212 | 64.1 | +34.5 | ||
| Conservative hold | Swing | ||||
Regent
| Party | Candidate | Votes | % | ±% | |
|---|---|---|---|---|---|
| Independent | J. Higginbottom | 1,144 | 43.9 | N/A | |
| Liberal | G. R. Greatorex* | 1,066 | 41.0 | −5.0 | |
| Labour | P. Moulson | 393 | 15.1 | −3.6 | |
| Majority | 78 | 2.9 | |||
| Turnout | 2,603 | 63.3 | +12.3 | ||
| Independent gain from Liberal | Swing | ||||
St. Matthias'
| Party | Candidate | Votes | % | ±% | |
|---|---|---|---|---|---|
| Liberal | J. Willett* | uncontested | |||
| Liberal hold | Swing | ||||
St. Paul's
| Party | Candidate | Votes | % | ±% | |
|---|---|---|---|---|---|
| Liberal | J. P. McDougall | 1,181 | 50.4 | N/A | |
| Labour | T. Wilber* | 1,162 | 49.6 | −1.1 | |
| Majority | 19 | 0.8 | |||
| Turnout | 2,343 | 53.8 | −6.4 | ||
| Liberal gain from Labour | Swing | ||||
St. Thomas'
| Party | Candidate | Votes | % | ±% | |
|---|---|---|---|---|---|
| Labour | J. W. Bloom | 1,219 | 55.9 | +8.5 | |
| Conservative | J. H. Coop* | 960 | 44.1 | −8.5 | |
| Majority | 259 | 11.8 | |||
| Turnout | 2,179 | 57.5 | +23.5 | ||
| Labour gain from Conservative | Swing | ||||
Seedley
| Party | Candidate | Votes | % | ±% | |
|---|---|---|---|---|---|
| Labour | J. E. Dale | 2,521 | 54.7 | −6.1 | |
| Conservative | J. F. Emery | 2,085 | 45.3 | N/A | |
| Majority | 436 | 9.4 | −12.2 | ||
| Turnout | 4,606 | 50.0 | +10.5 | ||
| Labour gain from Conservative | Swing | ||||
Trafford
| Party | Candidate | Votes | % | ±% | |
|---|---|---|---|---|---|
| Conservative | A. Williamson* | 1,374 | 59.8 | N/A | |
| Labour | F. Ramwell | 922 | 40.2 | N/A | |
| Majority | 452 | 19.6 | N/A | ||
| Turnout | 2,296 | 58.3 | N/A | ||
| Conservative hold | Swing | ||||
Trinity
| Party | Candidate | Votes | % | ±% | |
|---|---|---|---|---|---|
| Conservative | H. J. Wheatley | 803 | 51.8 | +8.1 | |
| Labour | J. Bradshaw | 748 | 48.2 | −0.6 | |
| Majority | 55 | 3.6 | |||
| Turnout | 1,551 | 53.8 | +5.5 | ||
| Conservative hold | Swing | ||||
Weaste
| Party | Candidate | Votes | % | ±% | |
|---|---|---|---|---|---|
| Labour | G. W. Sands | 1,268 | 53.9 | N/A | |
| Liberal | W. H. Parkinson | 1,084 | 46.1 | N/A | |
| Majority | 184 | 7.8 | N/A | ||
| Turnout | 2,352 | 50.2 | N/A | ||
| Labour gain from Liberal | Swing | ||||
Aldermanic elections
By-elections between 1920 and 1921
References
(1919 ←) | |
|---|---|
| England | |
| County councils (Ireland) | |
| Borough councils (Ireland) | |
| District councils (Ireland) |
|
| Counties of cities (Scotland) |
|
| Police burghs (Scotland) |
|
| County Councils (Wales) | |