1894 Manchester City Council election
| ||||||||||||||||||||||||||||||||||||||||||||||||||||||||||||||||||||||||||||||||||
26 of 104 seats to Manchester City Council 53 seats needed for a majority | ||||||||||||||||||||||||||||||||||||||||||||||||||||||||||||||||||||||||||||||||||
|---|---|---|---|---|---|---|---|---|---|---|---|---|---|---|---|---|---|---|---|---|---|---|---|---|---|---|---|---|---|---|---|---|---|---|---|---|---|---|---|---|---|---|---|---|---|---|---|---|---|---|---|---|---|---|---|---|---|---|---|---|---|---|---|---|---|---|---|---|---|---|---|---|---|---|---|---|---|---|---|---|---|---|
| ||||||||||||||||||||||||||||||||||||||||||||||||||||||||||||||||||||||||||||||||||
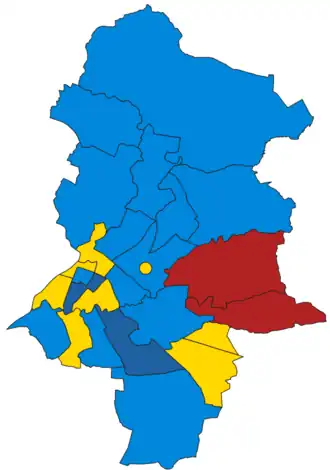 Map of results of 1894 election | ||||||||||||||||||||||||||||||||||||||||||||||||||||||||||||||||||||||||||||||||||
| ||||||||||||||||||||||||||||||||||||||||||||||||||||||||||||||||||||||||||||||||||
Elections to Manchester City Council were held on Thursday, 1 November 1894. One third of the councillors seats were up for election, with each successful candidate to serve a three-year term of office. The council remained under no overall control.[1][2]
Election result
| Party | Votes | Seats | Full Council | |||||||
| Liberal Party | 16,882 (33.3%) | 8 (30.8%) | 8 / 26
|
48 (46.2%) | 48 / 104
| |||||
| Conservative Party | 20,287 (40.1%) | 14 (53.8%) | 14 / 26
|
47 (45.2%) | 47 / 104
| |||||
| Liberal Unionist | 3,327 (6.6%) | 2 (7.7%) | 2 / 26
|
7 (6.7%) | 7 / 104
| |||||
| Ind. Labour Party | 10,032 (19.8%) | 2 (7.7%) | 2 / 26
|
2 (1.9%) | 2 / 104
| |||||
| Independent Liberal | 98 (0.2%) | N/A | 0 (0.0%) | 0 / 26
|
N/A | 0 (0.0%) | 0 / 104
| |||
Full council
| 2 | 48 | 7 | 47 |
Aldermen
| 14 | 5 | 7 |
Councillors
| 2 | 34 | 2 | 40 |
Ward results
All Saints'
| Party | Candidate | Votes | % | ±% | |
|---|---|---|---|---|---|
| Conservative | H. C. Smale | 1,041 | 60.3 | N/A | |
| Ind. Labour Party | M. Deller | 686 | 39.7 | N/A | |
| Majority | 355 | 20.6 | N/A | ||
| Turnout | 1,727 | ||||
| Conservative hold | Swing | ||||
Ardwick
| Party | Candidate | Votes | % | ±% | |
|---|---|---|---|---|---|
| Conservative | W. Fitzgerald* | 2,306 | 61.4 | +6.3 | |
| Liberal | R. A. Brown | 1,448 | 38.6 | −6.3 | |
| Majority | 858 | 22.8 | +12.6 | ||
| Turnout | 3,754 | ||||
| Conservative hold | Swing | ||||
Blackley & Moston
| Party | Candidate | Votes | % | ±% | |
|---|---|---|---|---|---|
| Conservative | T. Briggs* | uncontested | |||
| Conservative hold | Swing | ||||
Bradford
| Party | Candidate | Votes | % | ±% | |
|---|---|---|---|---|---|
| Ind. Labour Party | J. E. Sutton | 2,072 | 54.4 | N/A | |
| Conservative | E. Williams* | 1,737 | 45.6 | N/A | |
| Majority | 335 | 8.8 | N/A | ||
| Turnout | 3,809 | ||||
| Ind. Labour Party gain from Conservative | Swing | ||||
Cheetham
| Party | Candidate | Votes | % | ±% | |
|---|---|---|---|---|---|
| Conservative | J. Hampson* | 1,508 | 65.8 | N/A | |
| Liberal | R. Ramsbottom | 784 | 34.2 | N/A | |
| Majority | 724 | 31.6 | N/A | ||
| Turnout | 2,292 | ||||
| Conservative hold | Swing | ||||
Collegiate Church
| Party | Candidate | Votes | % | ±% | |
|---|---|---|---|---|---|
| Liberal | J. Royle* | uncontested | |||
| Liberal hold | Swing | ||||
Crumpsall
| Party | Candidate | Votes | % | ±% | |
|---|---|---|---|---|---|
| Conservative | E. Holt* | uncontested | |||
| Conservative hold | Swing | ||||
Exchange
| Party | Candidate | Votes | % | ±% | |
|---|---|---|---|---|---|
| Liberal | F. Smallman* | 346 | 50.7 | −11.1 | |
| Conservative | R. Cooper | 337 | 49.3 | N/A | |
| Majority | 9 | 1.4 | −22.2 | ||
| Turnout | 683 | ||||
| Liberal hold | Swing | ||||
Harpurhey
| Party | Candidate | Votes | % | ±% | |
|---|---|---|---|---|---|
| Conservative | G. Needham* | 2,616 | 54.8 | +12.3 | |
| Liberal | G. W. Chadwick | 1,125 | 23.6 | −19.0 | |
| Ind. Labour Party | J. Harker | 1,032 | 21.6 | +6.7 | |
| Majority | 1,491 | 31.2 | |||
| Turnout | 4,773 | ||||
| Conservative hold | Swing | ||||
Longsight
| Party | Candidate | Votes | % | ±% | |
|---|---|---|---|---|---|
| Liberal | T. Uttley* | 783 | 50.7 | N/A | |
| Conservative | J. Jones | 762 | 49.3 | N/A | |
| Majority | 21 | 1.4 | N/A | ||
| Turnout | 1,545 | ||||
| Liberal hold | Swing | ||||
Medlock Street
| Party | Candidate | Votes | % | ±% | |
|---|---|---|---|---|---|
| Liberal | W. T. Bax* | 1,782 | 65.0 | N/A | |
| Ind. Labour Party | J. Lee | 959 | 35.0 | −4.2 | |
| Majority | 823 | 30.0 | |||
| Turnout | 2,741 | ||||
| Liberal hold | Swing | ||||
Miles Platting
| Party | Candidate | Votes | % | ±% | |
|---|---|---|---|---|---|
| Conservative | S. Dixon | 1,083 | 49.7 | −8.0 | |
| Ind. Labour Party | H. Henshall | 607 | 27.9 | −14.4 | |
| Liberal | E. McGee | 488 | 22.4 | N/A | |
| Majority | 476 | 21.9 | +6.5 | ||
| Turnout | 2,178 | ||||
| Conservative hold | Swing | ||||
New Cross
| Party | Candidate | Votes | % | ±% | |
|---|---|---|---|---|---|
| Conservative | J. N. Ogden* | 1,950 | 38.5 | −0.3 | |
| Liberal | D. Boyle | 1,938 | 39.3 | −0.8 | |
| Liberal | E. M. Powell | 1,921 | 38.0 | −1.1 | |
| Liberal Unionist | H. C. Pingstone* | 1,789 | 35.3 | N/A | |
| Ind. Labour Party | J. Billam | 1,261 | 24.9 | −2.5 | |
| Majority | 17 | 0.3 | |||
| Turnout | 5,061 | ||||
| Conservative hold | Swing | ||||
| Liberal gain from Liberal Unionist | Swing | ||||
Newton Heath
| Party | Candidate | Votes | % | ±% | |
|---|---|---|---|---|---|
| Conservative | J. Garlick* | 1,241 | 55.9 | −17.7 | |
| Liberal | G. Evans | 981 | 44.1 | N/A | |
| Majority | 260 | 11.8 | −35.4 | ||
| Turnout | 2,222 | ||||
| Conservative hold | Swing | ||||
Openshaw
| Party | Candidate | Votes | % | ±% | |
|---|---|---|---|---|---|
| Ind. Labour Party | J. Butler | 1,464 | 50.4 | N/A | |
| Conservative | H. P. Ilderton | 1,442 | 49.6 | +12.0 | |
| Majority | 22 | 0.8 | |||
| Turnout | 2,906 | ||||
| Ind. Labour Party gain from Conservative | Swing | ||||
Oxford
| Party | Candidate | Votes | % | ±% | |
|---|---|---|---|---|---|
| Liberal | W. Simpson* | uncontested | |||
| Liberal hold | Swing | ||||
Rusholme
| Party | Candidate | Votes | % | ±% | |
|---|---|---|---|---|---|
| Conservative | F. E. Estcourt* | 823 | 53.1 | +18.8 | |
| Liberal | E. C. Harding | 728 | 46.9 | −18.8 | |
| Majority | 95 | 6.2 | |||
| Turnout | 1,551 | ||||
| Conservative hold | Swing | ||||
St. Ann's
| Party | Candidate | Votes | % | ±% | |
|---|---|---|---|---|---|
| Conservative | W. H. Vaudrey* | uncontested | |||
| Conservative hold | Swing | ||||
St. Clement's
| Party | Candidate | Votes | % | ±% | |
|---|---|---|---|---|---|
| Conservative | J. H. Andrews* | uncontested | |||
| Conservative hold | Swing | ||||
St. George's
| Party | Candidate | Votes | % | ±% | |
|---|---|---|---|---|---|
| Conservative | S. W. Royse | 1,826 | 50.6 | −11.9 | |
| Liberal | P. Mooney | 1,166 | 32.3 | N/A | |
| Ind. Labour Party | R. Anderson | 615 | 17.1 | −20.4 | |
| Majority | 660 | 18.3 | −6.7 | ||
| Turnout | 3,607 | ||||
| Conservative gain from Liberal | Swing | ||||
St. James'
| Party | Candidate | Votes | % | ±% | |
|---|---|---|---|---|---|
| Liberal Unionist | A. Murray* | uncontested | |||
| Liberal Unionist hold | Swing | ||||
St. John's
| Party | Candidate | Votes | % | ±% | |
|---|---|---|---|---|---|
| Liberal | M. Wells | 452 | 49.7 | −5.1 | |
| Conservative | T. Watmough | 369 | 40.6 | −4.6 | |
| Ind. Labour Party | W. Harley | 88 | 9.7 | N/A | |
| Majority | 83 | 9.1 | −0.5 | ||
| Turnout | 909 | ||||
| Liberal gain from Conservative | Swing | ||||
St. Luke's
| Party | Candidate | Votes | % | ±% | |
|---|---|---|---|---|---|
| Liberal Unionist | W. J. Sinclair* | 1,538 | 73.9 | N/A | |
| Ind. Labour Party | F. Leeming | 542 | 26.1 | +10.2 | |
| Majority | 996 | 47.8 | |||
| Turnout | 2,080 | ||||
| Liberal Unionist hold | Swing | ||||
St. Mark's
| Party | Candidate | Votes | % | ±% | |
|---|---|---|---|---|---|
| Liberal | W. H. Wainwright* | 1,140 | 61.8 | N/A | |
| Ind. Labour Party | F. Lawler | 706 | 38.2 | −7.1 | |
| Majority | 434 | 23.6 | |||
| Turnout | 1,846 | ||||
| Liberal hold | Swing | ||||
St. Michael's
| Party | Candidate | Votes | % | ±% | |
|---|---|---|---|---|---|
| Conservative | J. Faulkner | 1,246 | 40.1 | N/A | |
| Liberal | T. Quinn Ruddin | 1,165 | 37.4 | +28.9 | |
| Liberal | J. McCreesh* | 605 | 19.4 | −72.1 | |
| Independent Liberal | W. Brown | 98 | 3.1 | −5.4 | |
| Majority | 81 | 2.7 | |||
| Turnout | 3,114 | ||||
| Conservative gain from Liberal | Swing | ||||