1997 Nottinghamshire County Council election
| |||||||||||||||||
All 63 seats to Nottinghamshire County Council 32 seats needed for a majority | |||||||||||||||||
|---|---|---|---|---|---|---|---|---|---|---|---|---|---|---|---|---|---|
| |||||||||||||||||
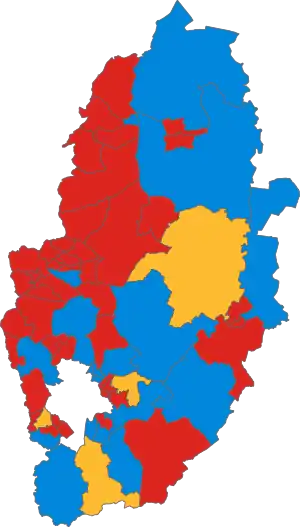 Map of the results of the election in each division. Colours denote the winning party, as shown in the main table of results. | |||||||||||||||||
| |||||||||||||||||
The 1997 Nottinghamshire County Council election was held on Thursday, 1 May 1997. The whole council was up for election and the result was the Labour Party retaining its control of the council.[1][2]
This was the first County Council election not to include the City of Nottingham, which would become a unitary authority in 1998 and therefore no longer a part of the administrative county of Nottinghamshire. The boundaries of the electoral divisions remained the same however the loss of Nottingham meant that there were 25 fewer seats.
Election results
| Party | Seats | Gains | Losses | Net gain/loss | Seats % | Votes % | Votes | +/− | |
|---|---|---|---|---|---|---|---|---|---|
| Labour | 42 | 48.4 | |||||||
| Conservative | 17 | 34.7 | |||||||
| Liberal Democrats | 4 | 15.6 | |||||||
Results by electoral division
Ashfield
(9 seats, 9 electoral divisions)
Hucknall East
| Party | Candidate | Votes | % | ±% | |
|---|---|---|---|---|---|
| Labour | Chris Baron | 5,038 | 71.0 | ||
| Conservative | Stephen Glover | 2,055 | 29.0 | ||
| Turnout | 7,093 | 70.7 | |||
| Registered electors | 10,031 | ||||
Hucknall West
| Party | Candidate | Votes | % | ±% | |
|---|---|---|---|---|---|
| Labour | Nellie Smedley | 6,476 | 68.7 | ||
| Conservative | John Tomlinson | 2,955 | 31.3 | ||
| Turnout | 13,175 | 100.0 | |||
| Registered electors | 13,175 | ||||
Kirkby in Ashfield North
| Party | Candidate | Votes | % | ||
|---|---|---|---|---|---|
| Labour | Richard Needham | Unopposed | |||
Kirkby in Ashfield South
| Party | Candidate | Votes | % | ±% | |
|---|---|---|---|---|---|
| Labour | Gordon Young | 4,857 | 65.6 | ||
| Conservative | Aubrey Hobson | 2,550 | 34.4 | ||
| Turnout | 7,407 | 70.9 | |||
| Registered electors | 10,451 | ||||
Selston
| Party | Candidate | Votes | % | ±% | |
|---|---|---|---|---|---|
| Labour | Joan Taylor | 3,951 | 58.5 | ||
| Conservative | Gillian Renshaw | 1,729 | 25.6 | ||
| Liberal Democrats | Robert Sears-Piccavey | 1,070 | 15.9 | ||
| Turnout | 6,750 | 69.9 | |||
| Registered electors | 9,654 | ||||
References
- ^ a b "Election Results". Nottinghamshire County Council. Retrieved 3 September 2016.
- ^ "Nottinghamshire County Council Election Results 1973-2009" (PDF). Elections Centre. Retrieved 3 September 2016.
| County councils |
|
|---|---|
| Unitary authorities |
|
| District councils (England) |
|
| District councils (Northern Ireland) | |
| Sui generis |
|
| Referendums | |
| |