2014 Bassetlaw District Council election
| |||||||||||||||||||||||||
One third of seats to Bassetlaw District Council (16 seats) 25 seats needed for a majority | |||||||||||||||||||||||||
|---|---|---|---|---|---|---|---|---|---|---|---|---|---|---|---|---|---|---|---|---|---|---|---|---|---|
| |||||||||||||||||||||||||
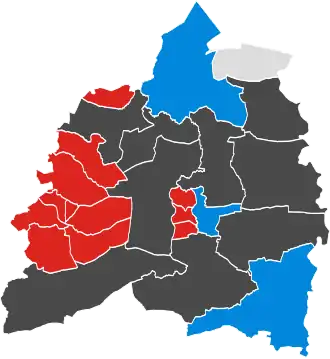 No election Colours denote the winning party, as shown in the main table of results. | |||||||||||||||||||||||||
| |||||||||||||||||||||||||
The 2014 Bassetlaw District Council election took place on 22 May 2014 to elect members of Bassetlaw District Council in England.[1] This was on the same day as other local elections. One third of the council was up for election.[2]
Results
| Party | Seats | Gains | Losses | Net gain/loss | Seats % | Votes % | Votes | +/− | |
|---|---|---|---|---|---|---|---|---|---|
| Labour | 12 | 75.0% | 49.8% | 11266 | |||||
| Conservative | 3 | 18.7% | 19.5% | 4418 | |||||
| Other parties | 1 | 6.3% | 2.9% | 652 | |||||
| UKIP | 0 | 0.0% | 26.3% | 5945 | |||||
| Liberal Democrats | 0 | 0.0% | 1.5% | 345 | |||||
Carlton
| Party | Candidate | Votes | % | ±% | |
|---|---|---|---|---|---|
| Labour | Robin Carrington-Wilde | 784 | 48.7% | ||
| UKIP | Roger Martin Vernon | 441 | 27.3% | ||
| Conservative | Wayne Roy Clarke | 386 | 24% | ||
| Turnout | |||||
East Retford East
| Party | Candidate | Votes | % | ±% | |
|---|---|---|---|---|---|
| Conservative | Mike Quigley | 727 | 38.2% | ||
| Labour | Andy Jee | 702 | 36.9% | ||
| UKIP | Kristian Denman | 386 | 20.3% | ||
| Liberal Democrats | Leon Duveen | 86 | 4.5% | ||
| Turnout | |||||
East Retford North
| Party | Candidate | Votes | % | ±% | |
|---|---|---|---|---|---|
| Labour | Graham Oxby | 1,013 | 54.6% | ||
| Conservative | Steve Vickers | 410 | 22.1% | ||
| UKIP | Gyll Smith | 388 | 20.9% | ||
| Liberal Democrats | Mark Hunter | 45 | 2.4% | ||
| Turnout | |||||
East Retford South
| Party | Candidate | Votes | % | ±% | |
|---|---|---|---|---|---|
| Labour | Carolyn Troop | 642 | 54.6% | ||
| UKIP | Chris Walters | 314 | 26.7% | ||
| Conservative | Bryn Jones | 220 | 18.7% | ||
| Turnout | |||||
East Retford West
| Party | Candidate | Votes | % | ±% | |
|---|---|---|---|---|---|
| Labour | Ian Campbell | 544 | 48.5% | ||
| UKIP | Jon Wade | 292 | 26.1% | ||
| Conservative | Jamie Ditch | 232 | 20.7% | ||
| Liberal Democrats | Jennifier Coggles | 53 | 4.7% | ||
| Turnout | |||||
Everton
| Party | Candidate | Votes | % | ±% | |
|---|---|---|---|---|---|
| Conservative | Anette Simpson | 360 | 50.7% | ||
| UKIP | Diana Capp | 166 | 23.4% | ||
| Labour | Sarah Farncombe | 145 | 20.4% | ||
| Liberal Democrats | Darren Burr | 39 | 5.5% | ||
| Turnout | |||||
Harworth
| Party | Candidate | Votes | % | ±% | |
|---|---|---|---|---|---|
| Labour | Anita Smith | 1,064 | 76.6% | ||
| UKIP | Peter Hewkin | 169 | 12.2% | ||
| Conservative | Rob Robson | 156 | 11.2% | ||
| Turnout | |||||
Langold
| Party | Candidate | Votes | % | ±% | |
|---|---|---|---|---|---|
| Labour | Jill Freeman | 391 | 64.6% | ||
| UKIP | David Jackson | 186 | 30.7% | ||
| Conservative | Dianne Hare | 28 | 4.6% | ||
| Turnout | |||||
| Labour hold | Swing | ||||
Misterton
| Party | Candidate | Votes | % | ±% | |
|---|---|---|---|---|---|
| Independent | Hazel Brand | 491 | 66.4% | ||
| UKIP | Roger Capp | 150 | 20.3% | ||
| Conservative | Simon Taylor | 98 | 13.3% | ||
| Turnout | |||||
Tuxford and Trent
| Party | Candidate | Votes | % | ±% | |
|---|---|---|---|---|---|
| Conservative | Keith Isard | 562 | 41.7% | ||
| Labour | Ross Moloney | 443 | 32.9% | ||
| UKIP | Trevor Fisher | 343 | 25.4% | ||
| Turnout | |||||
Worksop East
| Party | Candidate | Votes | % | ±% | |
|---|---|---|---|---|---|
| Labour | Griff Wynne | 914 | 59.4% | ||
| UKIP | Michael Lowe | 463 | 30.1% | ||
| Independent | Geoff Coe | 161 | 10.5% | ||
| Turnout | |||||
Worksop North
| Party | Candidate | Votes | % | ±% | |
|---|---|---|---|---|---|
| Labour | David Potts | 980 | 51.4% | ||
| UKIP | Deidre Vernon | 593 | 31.1% | ||
| Conservative | Perry Offer | 333 | 17.5% | ||
| Turnout | |||||
Worksop North East
| Party | Candidate | Votes | % | ±% | |
|---|---|---|---|---|---|
| Labour | Maddy Richardson | 868 | 53.5% | ||
| UKIP | Tony Clayton | 467 | 28.8% | ||
| Conservative | Emma Aukland | 288 | 17.7% | ||
| Turnout | |||||
Worksop North West
| Party | Candidate | Votes | % | ±% | |
|---|---|---|---|---|---|
| Labour | David Pressley | 910 | 56.7% | ||
| UKIP | Ivor Jones | 696 | 43.3% | ||
| Turnout | |||||
Worksop South
| Party | Candidate | Votes | % | ±% | |
|---|---|---|---|---|---|
| Labour | Kevin Greaves | 795 | 42.1% | ||
| Conservative | Adam Gray | 524 | 27.7% | ||
| UKIP | Dave Scott | 498 | 26.4% | ||
| Liberal Democrats | Peter Thompson | 72 | 3.8% | ||
| Turnout | |||||
Worksop South East
| Party | Candidate | Votes | % | ±% | |
|---|---|---|---|---|---|
| Labour | Deirdre Foley | 1,071 | 66.6% | ||
| UKIP | Anthony Keeling | 393 | 24.4% | ||
| Conservative | Nathan Gray | 94 | 5.9% | ||
| Liberal Democrats | Carole Thompson | 50 | 3.1% | ||
| Turnout | |||||
References
- ^ "England council results". BBC News. Retrieved 23 May 2014.
- ^ "Bassetlaw District Council". Bassetlaw District Council Elections. Bassetlaw District Council. Archived from the original on 29 October 2013. Retrieved 5 October 2013.
- ^ "District Election Results - These are the results for the District Elections held on 22nd May 2014". bassetlaw.gov.uk. Archived from the original on 30 May 2014.