2001 Nottinghamshire County Council election
| |||||||||||||||||||||||||||||||||
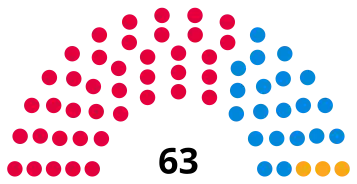
All 63 seats to Nottinghamshire County Council 32 seats needed for a majority | |||||||||||||||||||||||||||||||||
|---|---|---|---|---|---|---|---|---|---|---|---|---|---|---|---|---|---|---|---|---|---|---|---|---|---|---|---|---|---|---|---|---|---|
| Turnout | 60.5% | ||||||||||||||||||||||||||||||||
| |||||||||||||||||||||||||||||||||
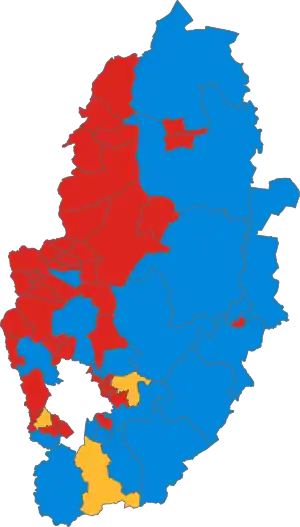 Map of the results of the election in each division. Colours denote the winning party, as shown in the main table of results. | |||||||||||||||||||||||||||||||||
| |||||||||||||||||||||||||||||||||
The 2001 Nottinghamshire County Council election was held on Thursday, 7 June 2001. The whole council was up for election and the result was the Labour Party retaining its control of the council.[1][2]
Election results
| Overall Turnout | ||||
|---|---|---|---|---|
| Registered electors | 581,836 | |||
| Votes cast | 352,237 | |||
| Turnout | 60.5% | |||
| 2001 Nottinghamshire County Council election | ||||||||||
|---|---|---|---|---|---|---|---|---|---|---|
| Party | Candidates | Seats | Gains | Losses | Net gain/loss | Seats % | Votes % | Votes | +/− | |
| Labour | 63 | 40 | 44.2 | 155,587 | ||||||
| Conservative | 63 | 20 | 36.1 | 127,039 | ||||||
| Liberal Democrats | 41 | 3 | 14.7 | 51,647 | ||||||
| Independent | 16 | 0 | 3.8 | 13,252 | ||||||
| Green | 12 | 0 | 1.2 | 4,328 | ||||||
| Socialist Alliance (England) | 1 | 0 | 0.1 | 262 | ||||||
| BNP | 1 | 0 | 0.1 | 122 | ||||||
Results by electoral division
Ashfield
(9 seats, 9 electoral divisions)
| Ashfield District | |||||||||||||||
|---|---|---|---|---|---|---|---|---|---|---|---|---|---|---|---|
| Party | Candidates | Votes | |||||||||||||
| Stood | Elected | Gained | Unseated | Net | % of total | % | No. | Net % | |||||||
| Labour | 9 | 9 | 0 | 0 | 57.8 | 26,706 | |||||||||
| Conservative | 9 | 0 | 0 | 0 | 27.6 | 12,771 | |||||||||
| Independent | 5 | 0 | 0 | 0 | 11.0 | 5,097 | |||||||||
| Green | 3 | 0 | 0 | 0 | 2.8 | 1,284 | |||||||||
| Socialist Alliance | 1 | 0 | 0 | 0 | 0.6 | 262 | |||||||||
| BNP | 1 | 0 | 0 | 0 | 0.3 | 122 | |||||||||
| Ashfield Turnout | ||||
|---|---|---|---|---|
| Registered electors | 86,806 | |||
| Votes cast | 46,242 | |||
| Turnout | 53.3% | |||
Hucknall East
| Party | Candidate | Votes | % | ±% | |
|---|---|---|---|---|---|
| Labour | Chris Baron | 3,080 | 56.4 | ||
| Conservative | M Spencer | 1,332 | 24.4 | ||
| Independent | R Gow | 1,052 | 19.3 | ||
| Turnout | 5,464 | 54.7 | |||
| Registered electors | 9,995 | ||||
Hucknall West
| Party | Candidate | Votes | % | ±% | |
|---|---|---|---|---|---|
| Labour | Nellie Smedley | 4,902 | 64.6 | ||
| Conservative | S Robbins | 2,686 | 35.4 | ||
| Turnout | 7,588 | 56.9 | |||
| Registered electors | 13,327 | ||||
Kirkby in Ashfield North
| Party | Candidate | Votes | % | ±% | |
|---|---|---|---|---|---|
| Labour | Richard Needham | 2,787 | 54.0 | ||
| Independent | Robert Hook | 1,025 | 19.9 | ||
| Conservative | Sylvia Baker | 1,001 | 19.4 | ||
| Green | Justin Smith | 350 | 6.8 | ||
| Turnout | 5,163 | 49.5 | |||
| Registered electors | 10,424 | ||||
Kirkby in Ashfield South
| Party | Candidate | Votes | % | ±% | |
|---|---|---|---|---|---|
| Labour | Yvonne Davidson | 2,665 | 46.4 | ||
| Conservative | A Hobson | 1,829 | 31.8 | ||
| Independent | N Woolley | 640 | 11.1 | ||
| Green | M Harrison | 615 | 10.7 | ||
| Turnout | 5,749 | 55.6 | |||
| Registered electors | 10,340 | ||||
Selston
| Party | Candidate | Votes | % | ±% | |
|---|---|---|---|---|---|
| Labour | Joan Taylor | 2,579 | 48.5 | ||
| Independent | Gail Turner | 1,502 | 28.2 | ||
| Conservative | Roma Cox | 1,242 | 23.3 | ||
| Turnout | 5,323 | 54.5 | |||
| Registered electors | 9,769 | ||||
Sutton in Ashfield Central
| Party | Candidate | Votes | % | ±% | |
|---|---|---|---|---|---|
| Labour | Edward Llewellyn-Jones | 2,341 | 56.7 | ||
| Independent | W Shaw | 878 | 21.3 | ||
| Conservative | T Chandran | 787 | 19.1 | ||
| BNP | A Johnson | 122 | 3.0 | ||
| Turnout | 4,128 | 49.8 | |||
| Registered electors | 8,295 | ||||
Sutton in Ashfield East
| Party | Candidate | Votes | % | ±% | |
|---|---|---|---|---|---|
| Labour | Steve Carroll | 2,760 | 73.3 | ||
| Conservative | Eugene Di Villa | 1,005 | 26.7 | ||
| Turnout | 3,765 | 49.9 | |||
| Registered electors | 7,543 | ||||
Sutton in Ashfield North
| Party | Candidate | Votes | % | ±% | |
|---|---|---|---|---|---|
| Labour | Dick Anthony | 2,553 | 57.7 | ||
| Conservative | John Baker | 1,291 | 29.2 | ||
| Green | Daniela Perschke | 319 | 7.2 | ||
| Socialist Alliance | Jeffrey Tucker | 262 | 5.9 | ||
| Turnout | 4,425 | 53.3 | |||
| Registered electors | 8,296 | ||||
Sutton in Ashfield West
| Party | Candidate | Votes | % | ±% | |
|---|---|---|---|---|---|
| Labour | David Kirkham | 3,039 | 65.5 | ||
| Conservative | Christine Vernon | 1,598 | 34.5 | ||
| Turnout | 4,637 | 52.6 | |||
| Registered electors | 8,817 | ||||
Bassetlaw
(9 seats, 9 electoral divisions)
| Bassetlaw District | |||||||||||||||
|---|---|---|---|---|---|---|---|---|---|---|---|---|---|---|---|
| Party | Candidates | Votes | |||||||||||||
| Stood | Elected | Gained | Unseated | Net | % of total | % | No. | Net % | |||||||
| Labour | 9 | 7 | 0 | 0 | 50.0 | 23,671 | |||||||||
| Conservative | 9 | 2 | 0 | 0 | 38.6 | 18,292 | |||||||||
| Liberal Democrats | 4 | 0 | 0 | 0 | 9.7 | 4,588 | |||||||||
| Independent | 1 | 0 | 0 | 0 | 1.0 | 470 | |||||||||
| Green | 1 | 0 | 0 | 0 | 0.7 | 309 | |||||||||
| Bassetlaw Turnout | ||||
|---|---|---|---|---|
| Registered electors | 81,562 | |||
| Votes cast | 47,330 | |||
| Turnout | 58.0% | |||
Blyth & Harworth
| Party | Candidate | Votes | % | ±% | |
|---|---|---|---|---|---|
| Labour | Sheila Place | 3,361 | 71.8 | ||
| Conservative | J Rickells | 1,318 | 28.2 | ||
| Turnout | 4,679 | 52.3 | |||
| Registered electors | 8,949 | ||||
Misterton
| Party | Candidate | Votes | % | ±% | |
|---|---|---|---|---|---|
| Conservative | Kenneth Bullivant | 3,376 | 51.9 | ||
| Liberal Democrats | Sean Kerrigan | 1,714 | 26.3 | ||
| Labour | Laurence West | 1,109 | 17.0 | ||
| Green | Paul Thorpe | 309 | 4.7 | ||
| Turnout | 6,508 | 64.1 | |||
| Registered electors | 10,145 | ||||
Retford North
| Party | Candidate | Votes | % | ±% | |
|---|---|---|---|---|---|
| Labour | James Napier | 2,187 | 41.1 | ||
| Conservative | Jean Bush | 2,054 | 38.6 | ||
| Liberal Democrats | Graham Read | 1,082 | 20.3 | ||
| Turnout | 5,323 | 64.4 | |||
| Registered electors | 8,264 | ||||
Retford South
| Party | Candidate | Votes | % | ±% | |
|---|---|---|---|---|---|
| Labour | Mick Storey | 2,455 | 51.5 | ||
| Conservative | James Holland | 1,542 | 32.4 | ||
| Liberal Democrats | John Bragger | 766 | 16.1 | ||
| Turnout | 4,763 | 58.8 | |||
| Registered electors | 8,097 | ||||
Tuxford
| Party | Candidate | Votes | % | ±% | |
|---|---|---|---|---|---|
| Conservative | John Hempsall | 3,153 | 52.6 | ||
| Labour | J Shephard | 1,818 | 30.3 | ||
| Liberal Democrats | P Horton | 1,026 | 17.1 | ||
| Turnout | 5,997 | 65.3 | |||
| Registered electors | 9,189 | ||||
Worksop East
| Party | Candidate | Votes | % | ±% | |
|---|---|---|---|---|---|
| Labour | Glynn Gilfoyle | 3,661 | 67.3 | ||
| Conservative | John Ogle | 1,782 | 32.7 | ||
| Turnout | 5,443 | 56.0 | |||
| Registered electors | 9,727 | ||||
Worksop North & Carlton
| Party | Candidate | Votes | % | ±% | |
|---|---|---|---|---|---|
| Labour | Roy Barsley | 3,627 | 62.9 | ||
| Conservative | D Hare | 2,137 | 37.1 | ||
| Turnout | 5,764 | 56.4 | |||
| Registered electors | 10,211 | ||||
Worksop South East & Welbeck
| Party | Candidate | Votes | % | ±% | |
|---|---|---|---|---|---|
| Labour | Vicki Smailes | 1,844 | 62.1 | ||
| Conservative | A Dibb | 655 | 22.1 | ||
| Independent | B Malacrida | 470 | 15.8 | ||
| Turnout | 2,969 | 51.4 | |||
| Registered electors | 5,775 | ||||
Worksop West
| Party | Candidate | Votes | % | ±% | |
|---|---|---|---|---|---|
| Labour | Alan Davison | 3,609 | 61.3 | ||
| Conservative | J Smith | 2,275 | 38.7 | ||
| Turnout | 5,884 | 52.5 | |||
| Registered electors | 11,205 | ||||
Broxtowe
(9 seats, 9 electoral divisions)
| Broxtowe District | |||||||||||||||
|---|---|---|---|---|---|---|---|---|---|---|---|---|---|---|---|
| Party | Candidates | Votes | |||||||||||||
| Stood | Elected | Gained | Unseated | Net | % of total | % | No. | Net % | |||||||
| Labour | 9 | 6 | 40.8 | 22,352 | |||||||||||
| Conservative | 9 | 2 | 33.4 | 18,281 | |||||||||||
| Liberal Democrats | 9 | 1 | 22.8 | 12,516 | |||||||||||
| Green | 3 | 0 | 0 | 0 | 2.0 | 1,082 | |||||||||
| Independent | 1 | 0 | 0 | 0 | 1.0 | 546 | |||||||||
| Broxtowe Turnout | ||||
|---|---|---|---|---|
| Registered electors | 84,576 | |||
| Votes cast | 54,777 | |||
| Turnout | 64.8% | |||
Beeston North
| Party | Candidate | Votes | % | ±% | |
|---|---|---|---|---|---|
| Labour | Maureen Tewson | 1,888 | 41.1 | ||
| Conservative | Joan Moodie | 1,337 | 29.1 | ||
| Liberal Democrats | Stephen Carr | 1,113 | 24.2 | ||
| Green | Sylvia Rule | 259 | 5.6 | ||
| Turnout | 4,597 | 63.2 | |||
| Registered electors | 7,270 | ||||
Beeston South
| Party | Candidate | Votes | % | ±% | |
|---|---|---|---|---|---|
| Labour | Michael Warner | 2,524 | 48.1 | ||
| Conservative | Daniel Walton | 1,360 | 25.9 | ||
| Liberal Democrats | Paul Fox | 840 | 16.0 | ||
| Green | Paul Anderson | 524 | 10.0 | ||
| Turnout | 5,248 | 61.2 | |||
| Registered electors | 8,581 | ||||
Bramcote & Stapleford East
| Party | Candidate | Votes | % | ±% | |
|---|---|---|---|---|---|
| Liberal Democrats | Stan Heptinstall | 2,988 | 46.6 | ||
| Conservative | A Ford | 1,939 | 30.2 | ||
| Labour | P Lally | 1,491 | 23.2 | ||
| Turnout | 6,418 | 71.5 | |||
| Registered electors | 8,973 | ||||
Chilwell
| Party | Candidate | Votes | % | ±% | |
|---|---|---|---|---|---|
| Labour | Gordon Skinner | 2,655 | 42.8 | ||
| Conservative | Richard Jackson | 2,320 | 37.4 | ||
| Liberal Democrats | Jacqueline Williams | 931 | 15.0 | ||
| Green | Richard Eddleston | 299 | 4.8 | ||
| Turnout | 6,205 | 69.1 | |||
| Registered electors | 8,985 | ||||
Eastwood & Brinsley
| Party | Candidate | Votes | % | ±% | |
|---|---|---|---|---|---|
| Labour | Eleanor Lodziak | 3,266 | 55.3 | ||
| Conservative | M Brown | 1,720 | 29.1 | ||
| Liberal Democrats | R Charlesworth | 919 | 15.6 | ||
| Turnout | 5,905 | 56.1 | |||
| Registered electors | 10,526 | ||||
Greasley & Nuthall
| Party | Candidate | Votes | % | ±% | |
|---|---|---|---|---|---|
| Conservative | David Taylor | 3,726 | 42.5 | ||
| Labour | D Hedderly | 3,542 | 40.4 | ||
| Liberal Democrats | P Ogden | 954 | 10.9 | ||
| Independent | G Green | 546 | 6.2 | ||
| Turnout | 8,768 | 65.8 | |||
| Registered electors | 13,331 | ||||
Kimberley & Trowell
| Party | Candidate | Votes | % | ±% | |
|---|---|---|---|---|---|
| Labour | Richard Robinson | 2,287 | 38.1 | ||
| Liberal Democrats | Ken Rigby | 2,131 | 35.5 | ||
| Conservative | L Ball | 1,589 | 26.5 | ||
| Turnout | 6,007 | 65.1 | |||
| Registered electors | 9,229 | ||||
Stapleford North & West
| Party | Candidate | Votes | % | ±% | |
|---|---|---|---|---|---|
| Labour | John Bell | 2,364 | 45.6 | ||
| Liberal Democrats | M Rich | 1,720 | 33.2 | ||
| Conservative | S Bell | 1,096 | 21.2 | ||
| Turnout | 5,180 | 60.7 | |||
| Registered electors | 8,528 | ||||
Toton & Attenborough
| Party | Candidate | Votes | % | ±% | |
|---|---|---|---|---|---|
| Conservative | Tom Pettengell | 3,194 | 49.5 | ||
| Labour | F Prince | 2,335 | 36.2 | ||
| Liberal Democrats | C Wombwell | 920 | 14.3 | ||
| Turnout | 6,449 | 70.5 | |||
| Registered electors | 9,153 | ||||
Gedling
(9 seats, 9 electoral divisions)
| Gedling District | |||||||||||||||
|---|---|---|---|---|---|---|---|---|---|---|---|---|---|---|---|
| Party | Candidates | Votes | |||||||||||||
| Stood | Elected | Gained | Unseated | Net | % of total | % | No. | Net % | |||||||
| Labour | 9 | 5 | 42.9 | 23,499 | |||||||||||
| Conservative | 9 | 3 | 39.6 | 21,687 | |||||||||||
| Liberal Democrats | 7 | 1 | 13.4 | 7,359 | |||||||||||
| Independent | 2 | 0 | 0 | 0 | 3.1 | 1,676 | |||||||||
| Green | 2 | 0 | 0 | 0 | 0.9 | 507 | |||||||||
| Gedling Turnout | ||||
|---|---|---|---|---|
| Registered electors | 86,824 | |||
| Votes cast | 54,728 | |||
| Turnout | 63.0% | |||
Arnold Central
| Party | Candidate | Votes | % | ±% | |
|---|---|---|---|---|---|
| Conservative | Rod Kempster | 2,669 | 48.7 | ||
| Labour | Paul Feeney | 2,249 | 41.1 | ||
| Liberal Democrats | Christopher Pratt | 560 | 10.2 | ||
| Turnout | 5,478 | 65.3 | |||
| Registered electors | 8,393 | ||||
Arnold East
| Party | Candidate | Votes | % | ±% | |
|---|---|---|---|---|---|
| Conservative | Veronica Pepper | 2,778 | 42.3 | ||
| Labour | Barrie Bowker | 2,519 | 38.3 | ||
| Liberal Democrats | Janice Lambert | 697 | 10.6 | ||
| Independent | Don Stickland | 337 | 5.1 | ||
| Green | Henry Wheeler | 238 | 3.6 | ||
| Turnout | 6,569 | 64.2 | |||
| Registered electors | 10,237 | ||||
Arnold West
| Party | Candidate | Votes | % | ±% | |
|---|---|---|---|---|---|
| Labour | James Woodward | 2,014 | 42.0 | ||
| Conservative | Melvyn Shepherd | 1,959 | 40.8 | ||
| Liberal Democrats | Andrew Swift | 826 | 17.2 | ||
| Turnout | 4,799 | 65.3 | |||
| Registered electors | 7,345 | ||||
Calverton
| Party | Candidate | Votes | % | ±% | |
|---|---|---|---|---|---|
| Labour | John Stocks | 3,294 | 49.6 | ||
| Conservative | Graham Kilbourne | 2,005 | 30.2 | ||
| Independent | Grant Withers | 1,339 | 20.2 | ||
| Turnout | 6,638 | 63.6 | |||
| Registered electors | 10,444 | ||||
Carlton Central
| Party | Candidate | Votes | % | ±% | |
|---|---|---|---|---|---|
| Labour | Christopher Preston | 2,725 | 49.5 | ||
| Conservative | Eric Collin | 1,927 | 35.0 | ||
| Liberal Democrats | Anthony Gillam | 848 | 15.4 | ||
| Turnout | 5,500 | 61.5 | |||
| Registered electors | 8,943 | ||||
Carlton East
| Party | Candidate | Votes | % | ±% | |
|---|---|---|---|---|---|
| Liberal Democrats | Raymond Poynter | 2,815 | 43.3 | ||
| Conservative | Alan Bexon | 2,206 | 33.9 | ||
| Labour | Jim Creamer | 1,480 | 22.8 | ||
| Turnout | 6,501 | 67.5 | |||
| Registered electors | 9,638 | ||||
Carlton South
| Party | Candidate | Votes | % | ±% | |
|---|---|---|---|---|---|
| Labour | John Clarke | 3,644 | 49.7 | ||
| Conservative | Richard Robinson | 2,525 | 34.4 | ||
| Liberal Democrats | Andrew Dunkin | 901 | 12.3 | ||
| Green | Jean Katimertzis | 269 | 3.7 | ||
| Turnout | 7,339 | 57.2 | |||
| Registered electors | 12,837 | ||||
Carlton West
| Party | Candidate | Votes | % | ±% | |
|---|---|---|---|---|---|
| Labour | Darrell Pulk | 2,794 | 49.5 | ||
| Conservative | G Clarke | 2,137 | 37.9 | ||
| Liberal Democrats | P Hughes | 712 | 12.6 | ||
| Turnout | 5,643 | 62.5 | |||
| Registered electors | 9,031 | ||||
Newstead
| Party | Candidate | Votes | % | ±% | |
|---|---|---|---|---|---|
| Conservative | Joe Lonergan | 3,481 | 55.6 | ||
| Labour | John Knight | 2,780 | 44.4 | ||
| Turnout | 6,261 | 62.9 | |||
| Registered electors | 9,956 | ||||
Mansfield
(9 seats, 9 electoral divisions)
| Mansfield District | |||||||||||||||
|---|---|---|---|---|---|---|---|---|---|---|---|---|---|---|---|
| Party | Candidates | Votes | |||||||||||||
| Stood | Elected | Gained | Unseated | Net | % of total | % | No. | Net % | |||||||
| Labour | 9 | 8 | 53.0 | 22,096 | |||||||||||
| Conservative | 9 | 1 | 26.7 | 11,135 | |||||||||||
| Liberal Democrats | 6 | 0 | 12.1 | 5,043 | |||||||||||
| Independent | 3 | 0 | 0 | 0 | 5.4 | 2,268 | |||||||||
| Green | 3 | 0 | 0 | 0 | 2.7 | 1,146 | |||||||||
| Mansfield Turnout | ||||
|---|---|---|---|---|
| Registered electors | 76,074 | |||
| Votes cast | 41,688 | |||
| Turnout | 54.8% | |||
Cumberlands & Ladybrook
| Party | Candidate | Votes | % | ±% | |
|---|---|---|---|---|---|
| Labour | Rita Sharpe | 2,481 | 56.1 | ||
| Conservative | M Allen | 767 | 17.3 | ||
| Independent | C Hallam | 626 | 14.2 | ||
| Liberal Democrats | J Smith | 550 | 12.4 | ||
| Turnout | 4,424 | 51.6 | |||
| Registered electors | 8,575 | ||||
Leeming & Forest Town
| Party | Candidate | Votes | % | ±% | |
|---|---|---|---|---|---|
| Labour | Parry Tsimbiridis | 2,836 | 47.4 | ||
| Conservative | P Moss | 1,647 | 27.6 | ||
| Liberal Democrats | D Rumley | 1,182 | 19.8 | ||
| Green | M Comerford | 313 | 5.2 | ||
| Turnout | 5,978 | 55.1 | |||
| Registered electors | 10,841 | ||||
Northfield & Manor
| Party | Candidate | Votes | % | ±% | |
|---|---|---|---|---|---|
| Labour | Reginald Strauther | 2,470 | 55.7 | ||
| Conservative | K Ball | 1,116 | 25.1 | ||
| Liberal Democrats | J Smith | 852 | 19.2 | ||
| Turnout | 4,438 | 54.4 | |||
| Registered electors | 8,163 | ||||
Oak Tree & Lindhurst
| Party | Candidate | Votes | % | ±% | |
|---|---|---|---|---|---|
| Labour | Terence Butler | 1,948 | 49.1 | ||
| Conservative | K Rees | 1,090 | 27.5 | ||
| Liberal Democrats | M Knight | 656 | 16.5 | ||
| Green | J Frost | 274 | 6.9 | ||
| Turnout | 3,968 | 55.6 | |||
| Registered electors | 7,138 | ||||
Oakham & Berry Hill
| Party | Candidate | Votes | % | ±% | |
|---|---|---|---|---|---|
| Conservative | Kathryn Allsop | 2,738 | 47.2 | ||
| Labour | B Mason | 1,913 | 33.0 | ||
| Liberal Democrats | M Leal | 1,146 | 19.8 | ||
| Turnout | 5,797 | 63.3 | |||
| Registered electors | 9,161 | ||||
Pleasley Hill & Broomhill
| Party | Candidate | Votes | % | ±% | |
|---|---|---|---|---|---|
| Labour | John Carter | 2,147 | 56.1 | ||
| Independent | M Button | 1,055 | 27.5 | ||
| Conservative | B Freeman | 628 | 16.4 | ||
| Turnout | 3,830 | 54.6 | |||
| Registered electors | 7,018 | ||||
Ravensdale & Sherwood
| Party | Candidate | Votes | % | ±% | |
|---|---|---|---|---|---|
| Labour | Joyce Bosnjak | 2,134 | 49.1 | ||
| Conservative | N Bradshaw | 972 | 22.3 | ||
| Liberal Democrats | P Smith | 657 | 15.1 | ||
| Independent | C Smith | 587 | 13.5 | ||
| Turnout | 4,350 | 50.7 | |||
| Registered electors | 8,582 | ||||
Titchfield & Eakring
| Party | Candidate | Votes | % | ±% | |
|---|---|---|---|---|---|
| Labour | Chris Winterton | 2,257 | 60.9 | ||
| Conservative | D Hatton | 892 | 24.1 | ||
| Green | M J Jackson | 559 | 15.1 | ||
| Turnout | 3,708 | 50.2 | |||
| Registered electors | 7,383 | ||||
Warsop
| Party | Candidate | Votes | % | ±% | |
|---|---|---|---|---|---|
| Labour | Brian Smith | 3,910 | 75.3 | ||
| Conservative | K Allsop | 1,285 | 24.7 | ||
| Turnout | 5,195 | 56.4 | |||
| Registered electors | 9,213 | ||||
Newark and Sherwood
(9 seats, 9 electoral divisions)
| Newark and Sherwood District | |||||||||||||||
|---|---|---|---|---|---|---|---|---|---|---|---|---|---|---|---|
| Party | Candidates | Votes | |||||||||||||
| Stood | Elected | Gained | Unseated | Net | % of total | % | No. | Net % | |||||||
| Conservative | 9 | 5 | 39.0 | 20,514 | |||||||||||
| Labour | 9 | 4 | 37.8 | 19,904 | |||||||||||
| Liberal Democrats | 6 | 0 | 17.1 | 8,979 | |||||||||||
| Independent | 4 | 0 | 0 | 0 | 6.1 | 3,195 | |||||||||
| Newark and Sherwood Turnout | ||||
|---|---|---|---|---|
| Registered electors | 83,670 | |||
| Votes cast | 52,592 | |||
| Turnout | 62.9% | |||
Balderton
| Party | Candidate | Votes | % | ±% | |
|---|---|---|---|---|---|
| Conservative | Keith Walker | 3,042 | 43.4 | ||
| Labour | A Hannaford | 2,249 | 32.1 | ||
| Liberal Democrats | N Allen | 976 | 13.9 | ||
| Independent | D Logue | 744 | 10.6 | ||
| Turnout | 7,011 | 63.2 | |||
| Registered electors | 11,087 | ||||
Blidworth
| Party | Candidate | Votes | % | ±% | |
|---|---|---|---|---|---|
| Labour | Yvonne Woodhead | 2,357 | 58.9 | ||
| Independent | Geoff Merry | 899 | 22.5 | ||
| Conservative | Neil Dean | 743 | 18.6 | ||
| Turnout | 3,999 | 55.3 | |||
| Registered electors | 7,233 | ||||
Caunton
| Party | Candidate | Votes | % | ±% | |
|---|---|---|---|---|---|
| Conservative | Bruce Laughton | 3,225 | 42.0 | ||
| Liberal Democrats | Brendan Haigh | 2,714 | 35.4 | ||
| Labour | David Bates | 1,731 | 22.6 | ||
| Turnout | 7,670 | 70.6 | |||
| Registered electors | 10,868 | ||||
Collingham
| Party | Candidate | Votes | % | ±% | |
|---|---|---|---|---|---|
| Conservative | Vincent Dobson | 3,337 | 53.5 | ||
| Labour | Desmond Whicher | 1,606 | 25.7 | ||
| Liberal Democrats | Marylyn Rayner | 1,294 | 20.7 | ||
| Turnout | 6,237 | 67.3 | |||
| Registered electors | 9,266 | ||||
Newark North
| Party | Candidate | Votes | % | ±% | |
|---|---|---|---|---|---|
| Conservative | Peter Prebble | 2,087 | 38.8 | ||
| Labour | Victor Hall | 2,040 | 37.9 | ||
| Liberal Democrats | Gillian Dawn | 1,252 | 23.3 | ||
| Turnout | 5,379 | 56.0 | |||
| Registered electors | 9,599 | ||||
Newark South
| Party | Candidate | Votes | % | ±% | |
|---|---|---|---|---|---|
| Labour | Colin Bromfield | 1,857 | 55.5 | ||
| Conservative | Ann Marshall | 1,101 | 32.9 | ||
| Liberal Democrats | Francis Higson | 388 | 11.6 | ||
| Turnout | 3,346 | 52.8 | |||
| Registered electors | 6,337 | ||||
Ollerton
| Party | Candidate | Votes | % | ±% | |
|---|---|---|---|---|---|
| Labour | Stella Smedley | 3,739 | 71.1 | ||
| Conservative | Brian Jarvis | 1,522 | 28.9 | ||
| Turnout | 5,261 | 56.7 | |||
| Registered electors | 9,275 | ||||
Rufford
| Party | Candidate | Votes | % | ±% | |
|---|---|---|---|---|---|
| Labour | Andrew Freeman | 2,673 | 52.3 | ||
| Conservative | Mary Brown | 1,347 | 26.4 | ||
| Independent | Samuel Dunlop | 1,088 | 21.3 | ||
| Turnout | 5,108 | 60.9 | |||
| Registered electors | 8,381 | ||||
Southwell
| Party | Candidate | Votes | % | ±% | |
|---|---|---|---|---|---|
| Conservative | Samuel Stuart | 4,110 | 47.9 | ||
| Liberal Democrats | John Baker | 2,355 | 27.4 | ||
| Labour | Neil Fawkes | 1,652 | 19.3 | ||
| Independent | Timothy Cutler | 464 | 5.4 | ||
| Turnout | 8,581 | 73.8 | |||
| Registered electors | 11,624 | ||||
Rushcliffe
(9 seats, 9 electoral divisions)
| Rushcliffe District | |||||||||||||||
|---|---|---|---|---|---|---|---|---|---|---|---|---|---|---|---|
| Party | Candidates | Votes | |||||||||||||
| Stood | Elected | Gained | Unseated | Net | % of total | % | No. | Net % | |||||||
| Conservative | 9 | 7 | 44.4 | 24,359 | |||||||||||
| Labour | 9 | 1 | 31.6 | 17,359 | |||||||||||
| Liberal Democrats | 9 | 1 | 24.0 | 13,162 | |||||||||||
| Rushcliffe Turnout | ||||
|---|---|---|---|---|
| Registered electors | 82,324 | |||
| Votes cast | 54,880 | |||
| Turnout | 66.7% | |||
Bingham
| Party | Candidate | Votes | % | ±% | |
|---|---|---|---|---|---|
| Conservative | Martin Suthers | 3,409 | 45.0 | ||
| Liberal Democrats | George Davidson | 2,096 | 27.7 | ||
| Labour | Avril Bear | 2,072 | 27.3 | ||
| Turnout | 7,577 | 66.6 | |||
| Registered electors | 11,376 | ||||
Cotgrave
| Party | Candidate | Votes | % | ±% | |
|---|---|---|---|---|---|
| Conservative | Richard Butler | 2,790 | 44.1 | ||
| Labour | P Morrissey | 2,507 | 39.6 | ||
| Liberal Democrats | S Hull | 1,036 | 16.4 | ||
| Turnout | 6,333 | 64.5 | |||
| Registered electors | 9,816 | ||||
East Leake
| Party | Candidate | Votes | % | ±% | |
|---|---|---|---|---|---|
| Conservative | Kenneth O'Toole | 2,771 | 47.1 | ||
| Labour | Paul Jacques | 2,132 | 36.2 | ||
| Liberal Democrats | Daphne Butler | 984 | 16.7 | ||
| Turnout | 5,887 | 66.4 | |||
| Registered electors | 8,870 | ||||
Keyworth
| Party | Candidate | Votes | % | ±% | |
|---|---|---|---|---|---|
| Conservative | John Cottee | 2,852 | 48.5 | ||
| Liberal Democrats | Samuel Boote | 2,227 | 37.9 | ||
| Labour | Penelope Oldridge | 797 | 13.6 | ||
| Turnout | 5,876 | 71.7 | |||
| Registered electors | 8,192 | ||||
Radcliffe on Trent
| Party | Candidate | Votes | % | ±% | |
|---|---|---|---|---|---|
| Conservative | Kay Cutts | 2,492 | 51.9 | ||
| Labour | E Gamble | 1,459 | 30.4 | ||
| Liberal Democrats | D Allen | 853 | 17.8 | ||
| Turnout | 4,804 | 66.3 | |||
| Registered electors | 7,250 | ||||
Ruddington
| Party | Candidate | Votes | % | ±% | |
|---|---|---|---|---|---|
| Liberal Democrats | Susan Bennett | 2,086 | 41.2 | ||
| Conservative | Reg Adair | 2,083 | 41.2 | ||
| Labour | A Clayworth | 889 | 17.6 | ||
| Turnout | 5,058 | 69.7 | |||
| Registered electors | 7,259 | ||||
West Bridgford East
| Party | Candidate | Votes | % | ±% | |
|---|---|---|---|---|---|
| Labour | Graham Jackson | 3,116 | 46.8 | ||
| Conservative | Timothy Spencer | 2,333 | 35.0 | ||
| Liberal Democrats | Christopher Evans | 1,215 | 18.2 | ||
| Turnout | 6,664 | 66.4 | |||
| Registered electors | 10,029 | ||||
West Bridgford South
| Party | Candidate | Votes | % | ±% | |
|---|---|---|---|---|---|
| Conservative | Michael Cox | 2,742 | 47.4 | ||
| Labour | Gillian Aldridge | 1,748 | 30.2 | ||
| Liberal Democrats | Lawrence Porter | 1,297 | 22.4 | ||
| Turnout | 5,787 | 68.1 | |||
| Registered electors | 8,504 | ||||
West Bridgford West
| Party | Candidate | Votes | % | ±% | |
|---|---|---|---|---|---|
| Conservative | Martin Brandon-Bravo | 2,887 | 41.9 | ||
| Labour | A MacInnes | 2,639 | 38.3 | ||
| Liberal Democrats | J Banks | 1,368 | 19.8 | ||
| Turnout | 6,894 | 62.5 | |||
| Registered electors | 11,028 | ||||
References
- ^ "Election Results". Nottinghamshire County Council. Retrieved 3 September 2016.
- ^ "Nottinghamshire County Council Election Results 1973-2009" (PDF). Elections Centre. Retrieved 3 September 2016.
| County councils |
|
|---|---|
| Unitary authorities |
|
| District councils (Northern Ireland) | |
| Sui generis |
|
| |