2005 Staffordshire County Council election
| |||||||||||||||||||||||||||||||||||
All 62 seats to Staffordshire County Council 32 seats needed for a majority | |||||||||||||||||||||||||||||||||||
|---|---|---|---|---|---|---|---|---|---|---|---|---|---|---|---|---|---|---|---|---|---|---|---|---|---|---|---|---|---|---|---|---|---|---|---|
| |||||||||||||||||||||||||||||||||||
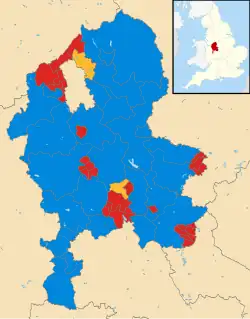 2005 local election results in Staffordshire | |||||||||||||||||||||||||||||||||||
| |||||||||||||||||||||||||||||||||||
Elections to Staffordshire County Council took place on 5 May 2005, the same day as the general election. All 62 seats were up for election.
Summary
The election was won by the Labour Party, with 32 seats.[1]
Overall results
| Party | Seats | Gains | Losses | Net gain/loss | Seats % | Votes % | Votes | +/− | |
|---|---|---|---|---|---|---|---|---|---|
| Labour | 32 | -4 | 52% | 38% | |||||
| Conservative | 28 | +4 | 45% | 38% | |||||
| Liberal Democrats | 2 | 0 | 3% | 20% | |||||
| UKIP | 0 | 0 | 0% | 1% | |||||
| Independent | 0 | 0 | 0% | <1% | |||||
| Freedom (UK) | 0 | 0 | 0% | <1% | |||||
| Ratepayers (SM) | 0 | 0 | 0% | <1% | |||||
| Green | 0 | 0 | 0% | <1% | |||||
References
- ^ a b "Staffordshire County Council Elections – Thursday 5th May 2005". Staffordshire County Council. Retrieved 9 May 2021.
| County council elections |
|
|---|---|
| Unitary authorities |
|
| District councils (Northern Ireland) | |
| Sui generis |
|
| Mayoral elections |
|
| |