La Faurie
La Faurie | |
|---|---|
 | |
 Coat of arms | |
Location of La Faurie | |
 La Faurie 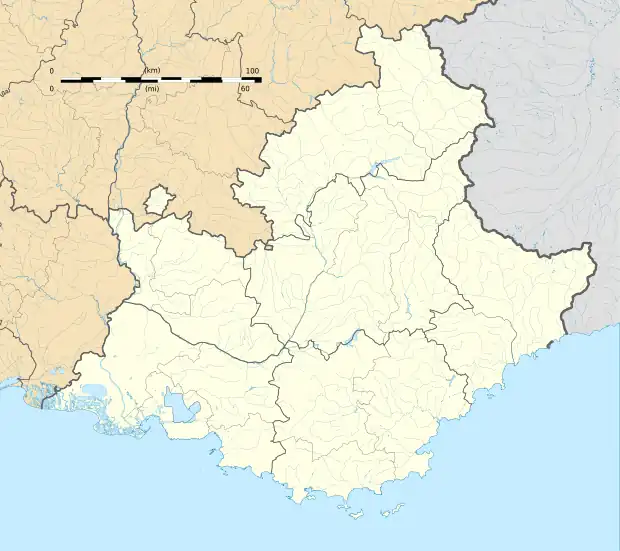 La Faurie | |
| Coordinates: 44°34′05″N 5°44′26″E / 44.5681°N 5.7406°E | |
| Country | France |
| Region | Provence-Alpes-Côte d'Azur |
| Department | Hautes-Alpes |
| Arrondissement | Gap |
| Canton | Serres |
| Government | |
| • Mayor (2020–2026) | Christiane Acanfora[1] |
Area 1 | 31.44 km2 (12.14 sq mi) |
| Population (2022)[2] | 298 |
| • Density | 9.5/km2 (25/sq mi) |
| Time zone | UTC+01:00 (CET) |
| • Summer (DST) | UTC+02:00 (CEST) |
| INSEE/Postal code | 05055 /05140 |
| Elevation | 780–2,063 m (2,559–6,768 ft) (avg. 876 m or 2,874 ft) |
| 1 French Land Register data, which excludes lakes, ponds, glaciers > 1 km2 (0.386 sq mi or 247 acres) and river estuaries. | |
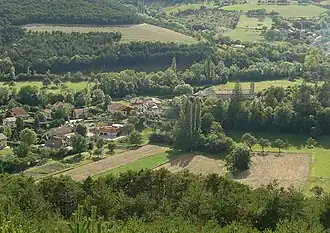
La Faurie (French pronunciation: [la foʁi]; Occitan: La Fauria) is a commune in the Hautes-Alpes department in southeastern France.
Geography
Climate
La Faurie has a warm-summer mediterranean climate (Köppen climate classification Csb). The average annual temperature in La Faurie is 9.3 °C (48.7 °F). The average annual rainfall is 937.6 mm (36.91 in) with October as the wettest month. The temperatures are highest on average in July, at around 18.4 °C (65.1 °F), and lowest in January, at around 0.4 °C (32.7 °F). The highest temperature ever recorded in La Faurie was 37.5 °C (99.5 °F) on 26 June 2019; the coldest temperature ever recorded was −21.4 °C (−6.5 °F) on 14 February 1999.
| Climate data for La Faurie (1981–2010 averages, extremes 1997−present) | |||||||||||||
|---|---|---|---|---|---|---|---|---|---|---|---|---|---|
| Month | Jan | Feb | Mar | Apr | May | Jun | Jul | Aug | Sep | Oct | Nov | Dec | Year |
| Record high °C (°F) | 20.3 (68.5) |
22.4 (72.3) |
23.4 (74.1) |
28.2 (82.8) |
30.8 (87.4) |
37.5 (99.5) |
36.2 (97.2) |
36.6 (97.9) |
34.3 (93.7) |
26.7 (80.1) |
23.1 (73.6) |
16.8 (62.2) |
37.5 (99.5) |
| Mean daily maximum °C (°F) | 6.4 (43.5) |
8.1 (46.6) |
11.7 (53.1) |
14.9 (58.8) |
20.0 (68.0) |
24.6 (76.3) |
27.2 (81.0) |
26.8 (80.2) |
21.9 (71.4) |
17.1 (62.8) |
10.0 (50.0) |
6.3 (43.3) |
16.3 (61.3) |
| Daily mean °C (°F) | 0.4 (32.7) |
1.7 (35.1) |
5.1 (41.2) |
8.1 (46.6) |
12.6 (54.7) |
16.3 (61.3) |
18.4 (65.1) |
18.2 (64.8) |
14.2 (57.6) |
10.3 (50.5) |
4.4 (39.9) |
1.0 (33.8) |
9.3 (48.7) |
| Mean daily minimum °C (°F) | −5.6 (21.9) |
−4.7 (23.5) |
−1.6 (29.1) |
1.2 (34.2) |
5.2 (41.4) |
8.1 (46.6) |
9.6 (49.3) |
9.6 (49.3) |
6.4 (43.5) |
3.5 (38.3) |
−1.2 (29.8) |
−4.4 (24.1) |
2.2 (36.0) |
| Record low °C (°F) | −19.4 (−2.9) |
−21.4 (−6.5) |
−14.0 (6.8) |
−9.5 (14.9) |
−3.9 (25.0) |
−1.9 (28.6) |
1.1 (34.0) |
0.6 (33.1) |
−2.5 (27.5) |
−8.4 (16.9) |
−15.4 (4.3) |
−19.8 (−3.6) |
−21.4 (−6.5) |
| Average precipitation mm (inches) | 68.2 (2.69) |
57.6 (2.27) |
63.3 (2.49) |
94.5 (3.72) |
92.6 (3.65) |
63.7 (2.51) |
35.6 (1.40) |
55.9 (2.20) |
99.7 (3.93) |
112.2 (4.42) |
108.6 (4.28) |
85.7 (3.37) |
937.6 (36.91) |
| Average precipitation days (≥ 1.0 mm) | 7.9 | 5.9 | 7.9 | 9.8 | 9.7 | 6.6 | 5.6 | 7.2 | 6.5 | 8.6 | 9.6 | 8.1 | 93.6 |
| Source: Meteociel[3] | |||||||||||||
Population
| Year | Pop. | ±% |
|---|---|---|
| 1962 | 226 | — |
| 1968 | 250 | +10.6% |
| 1975 | 227 | −9.2% |
| 1982 | 215 | −5.3% |
| 1990 | 224 | +4.2% |
| 1999 | 231 | +3.1% |
| 2008 | 322 | +39.4% |
See also
References
- ^ "Répertoire national des élus: les maires". data.gouv.fr, Plateforme ouverte des données publiques françaises (in French). 2 December 2020.
- ^ "Populations de référence 2022" (in French). The National Institute of Statistics and Economic Studies. 19 December 2024.
- ^ "Normales et records pour La Faurie (05)". Meteociel. Retrieved 6 June 2022.
Wikimedia Commons has media related to La Faurie.