1980 Thurrock Borough Council election
| ||||||||||||||||||||||||||||||||||||||||||||||||||||||||||||||||||||
15 out of 39 seats to Thurrock Borough Council 20 seats needed for a majority | ||||||||||||||||||||||||||||||||||||||||||||||||||||||||||||||||||||
|---|---|---|---|---|---|---|---|---|---|---|---|---|---|---|---|---|---|---|---|---|---|---|---|---|---|---|---|---|---|---|---|---|---|---|---|---|---|---|---|---|---|---|---|---|---|---|---|---|---|---|---|---|---|---|---|---|---|---|---|---|---|---|---|---|---|---|---|---|
| Registered | 84,432 | |||||||||||||||||||||||||||||||||||||||||||||||||||||||||||||||||||
| Turnout | 36.0% ( | |||||||||||||||||||||||||||||||||||||||||||||||||||||||||||||||||||
| ||||||||||||||||||||||||||||||||||||||||||||||||||||||||||||||||||||
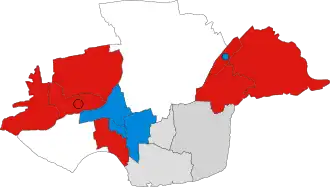 Winner of each seat at the 1980 Thurrock Borough Council election. | ||||||||||||||||||||||||||||||||||||||||||||||||||||||||||||||||||||
| ||||||||||||||||||||||||||||||||||||||||||||||||||||||||||||||||||||
The 1980 Thurrock Borough Council election took place on 1 May 1980 to elect members of Thurrock Borough Council in Essex, England.[1] This was on the same day as other local elections in England.
Summary
Election result
| 1980 Thurrock Borough Council election[2] | ||||||||||
|---|---|---|---|---|---|---|---|---|---|---|
| Party | This election | Full council | This election | |||||||
| Seats | Net | Seats % | Other | Total | Total % | Votes | Votes % | +/− | ||
| Labour | 8 | 53.3 | 11 | 19 | 48.7 | 16,646 | 49.2 | +3.3 | ||
| Conservative | 4 | 26.7 | 9 | 13 | 33.3 | 10,857 | 32.1 | –9.5 | ||
| Independent | 2 | 13.3 | 2 | 4 | 10.3 | 2,912 | 8.6 | +2.7 | ||
| Independent Labour | 0 | 0.0 | 2 | 2 | 5.1 | N/A | N/A | –1.6 | ||
| Residents | 1 | 6.7 | 0 | 1 | 2.6 | 1,939 | 5.7 | +3.9 | ||
| Liberal | 0 | 0.0 | 0 | 0 | 0.0 | 1,301 | 3.8 | +0.6 | ||
| Ecology | 0 | 0.0 | 0 | 0 | 0.0 | 156 | 0.5 | N/A | ||
Ward results
Aveley
| Party | Candidate | Votes | % | ±% | |
|---|---|---|---|---|---|
| Labour | A. May | 1,263 | 59.1 | +5.7 | |
| Conservative | F. Beasley* | 765 | 35.8 | –10.8 | |
| Liberal | J. Norris | 108 | 5.1 | N/A | |
| Majority | 498 | 23.3 | N/A | ||
| Turnout | 2,136 | 35.1 | –39.3 | ||
| Registered electors | 6,091 | ||||
| Labour gain from Conservative | Swing | ||||
Belhus
| Party | Candidate | Votes | % | ||
|---|---|---|---|---|---|
| Labour | J. Aberdein | 1,051 | 75.4 | ||
| Labour | R. Fall | 1,050 | 75.3 | ||
| Conservative | A. Blows | 354 | 25.4 | ||
| Conservative | J. Dobson | 333 | 23.9 | ||
| Turnout | ~1,395 | 22.3 | |||
| Registered electors | 6,257 | ||||
| Labour hold | |||||
| Labour hold | |||||
Chadwell St Mary
| Party | Candidate | Votes | % | ±% | |
|---|---|---|---|---|---|
| Independent | D. Hemmings | 1,221 | 43.9 | N/A | |
| Labour | P. Bolger* | 1,219 | 43.8 | –13.4 | |
| Conservative | G. Law | 286 | 10.3 | –20.8 | |
| Liberal | M. Haynes | 55 | 2.0 | –9.7 | |
| Majority | 2 | 0.1 | N/A | ||
| Turnout | 2,781 | 36.5 | –38.9 | ||
| Registered electors | 7,615 | ||||
| Independent gain from Labour | |||||
Corringham & Fobbing
| Party | Candidate | Votes | % | ±% | |
|---|---|---|---|---|---|
| Labour | A. Price* | 1,964 | 57.8 | +7.8 | |
| Conservative | B. Price | 1,169 | 34.4 | –15.6 | |
| Liberal | C. Bowler | 266 | 7.8 | N/A | |
| Majority | 795 | 23.4 | N/A | ||
| Turnout | 3,399 | 37.1 | –39.4 | ||
| Registered electors | 9,169 | ||||
| Labour hold | Swing | ||||
East Tilbury
| Party | Candidate | Votes | % | ±% | |
|---|---|---|---|---|---|
| Residents | D. Allchin* | 988 | 58.2 | +13.5 | |
| Labour | B. Legrys | 435 | 25.6 | –6.6 | |
| Conservative | P. Hartlebury | 249 | 14.7 | –8.4 | |
| Liberal | G. Merchant | 25 | 1.5 | N/A | |
| Majority | 553 | 32.6 | N/A | ||
| Turnout | 1,697 | 41.7 | –36.3 | ||
| Registered electors | 4,067 | ||||
| Residents hold | Swing | ||||
Grays Thurrock (North)
| Party | Candidate | Votes | % | ±% | |
|---|---|---|---|---|---|
| Conservative | M. Thomas* | 681 | 60.5 | +0.1 | |
| Labour | B. Newsome | 445 | 39.5 | –0.1 | |
| Majority | 236 | 21.0 | +0.2 | ||
| Turnout | 1,126 | 43.9 | –33.8 | ||
| Registered electors | 2,565 | ||||
| Conservative hold | Swing | ||||
Grays Thurrock (Town)
| Party | Candidate | Votes | % | ±% | |
|---|---|---|---|---|---|
| Labour | K. Evans* | 981 | 41.0 | +5.4 | |
| Residents | B. Taylor | 951 | 39.7 | +11.2 | |
| Conservative | G. Riches | 407 | 17.0 | –6.2 | |
| Liberal | A. Senior | 56 | 2.3 | –10.4 | |
| Majority | 30 | 1.3 | N/A | ||
| Turnout | 2,395 | 36.2 | –37.2 | ||
| Registered electors | 6,624 | ||||
| Labour hold | Swing | ||||
Little Thurrock
| Party | Candidate | Votes | % | ±% | |
|---|---|---|---|---|---|
| Conservative | J. Edwards* | 1,586 | 54.3 | –8.6 | |
| Labour | T. Codley | 1,103 | 37.8 | +0.7 | |
| Liberal | S. Senior | 158 | 5.4 | N/A | |
| Ecology | A. Metcalfe | 74 | 2.5 | N/A | |
| Majority | 483 | 16.5 | N/A | ||
| Turnout | 2,921 | 38.5 | –38.8 | ||
| Registered electors | 7,578 | ||||
| Conservative hold | Swing | ||||
Ockendon
| Party | Candidate | Votes | % | ±% | |
|---|---|---|---|---|---|
| Labour | R. Abel* | 1,449 | 68.7 | +8.5 | |
| Conservative | J. Stone | 659 | 31.3 | –8.5 | |
| Majority | 790 | 37.5 | N/A | ||
| Turnout | 2,108 | 30.7 | –42.5 | ||
| Registered electors | 6,874 | ||||
| Labour hold | Swing | ||||
Stanford-le-Hope
| Party | Candidate | Votes | % | ±% | |
|---|---|---|---|---|---|
| Labour | M. Meen* | 1,510 | 63.7 | +14.1 | |
| Conservative | A. McCartney | 860 | 36.3 | –14.1 | |
| Majority | 650 | 27.4 | N/A | ||
| Turnout | 2,370 | 31.0 | –44.2 | ||
| Registered electors | 7,643 | ||||
| Labour hold | Swing | ||||
Stifford
| Party | Candidate | Votes | % | ±% | |
|---|---|---|---|---|---|
| Conservative | A. Turner* | 1,735 | 51.9 | –1.6 | |
| Labour | P. Rice | 1,529 | 45.7 | –0.8 | |
| Ecology | M. Crowson | 82 | 2.5 | N/A | |
| Majority | 206 | 6.2 | N/A | ||
| Turnout | 3,346 | 51.4 | –27.0 | ||
| Registered electors | 6,512 | ||||
| Conservative hold | Swing | ||||
The Homesteads
| Party | Candidate | Votes | % | ||
|---|---|---|---|---|---|
| Labour | A. Clarke | 937 | 44.7 | ||
| Conservative | P. Povey | 918 | 43.8 | ||
| Labour | M. Bonfield | 917 | 43.7 | ||
| Conservative | L. Green | 855 | 40.8 | ||
| Liberal | C. Farrand | 296 | 14.1 | ||
| Liberal | G. Basson | 273 | 13.0 | ||
| Turnout | ~2,149 | 39.3 | |||
| Registered electors | 5,468 | ||||
| Labour gain from Conservative | |||||
| Conservative hold | |||||
Tilbury
| Party | Candidate | Votes | % | ±% | |
|---|---|---|---|---|---|
| Independent | T. Kendal* | 1,691 | 66.4 | +2.6 | |
| Labour | A. Fitzmaurice | 793 | 31.1 | +6.7 | |
| Liberal | M. Bamford | 64 | 2.5 | –2.7 | |
| Majority | 898 | 35.2 | N/A | ||
| Turnout | 2,548 | 32.0 | –36.3 | ||
| Registered electors | 7,969 | ||||
| Independent hold | Swing | ||||
References
- ^ "Thurrock Borough Council Election Results 1973-1996" (PDF). Colin Rallings and Michael Thrasher. The Elections Centre, Plymouth University. Retrieved 29 January 2025.
- ^ "Council composition calculator". Colin Rallings and Michael Thrasher. The Elections Centre, Plymouth University. Retrieved 29 January 2025.
| Metropolitan boroughs |
|
|---|---|
| District councils (England) |
|
| District councils (Scotland) |
|