1991 Thurrock Borough Council election
| |||||||||||||||||||||||||||||||||||||
13 out of 39 seats to Thurrock Borough Council 20 seats needed for a majority | |||||||||||||||||||||||||||||||||||||
|---|---|---|---|---|---|---|---|---|---|---|---|---|---|---|---|---|---|---|---|---|---|---|---|---|---|---|---|---|---|---|---|---|---|---|---|---|---|
| Registered | 88,846 | ||||||||||||||||||||||||||||||||||||
| Turnout | 31,531 35.5% ( | ||||||||||||||||||||||||||||||||||||
| |||||||||||||||||||||||||||||||||||||
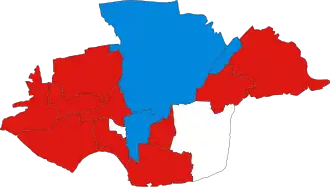 Winner of each seat at the 1991 Thurrock Borough Council election. | |||||||||||||||||||||||||||||||||||||
| |||||||||||||||||||||||||||||||||||||
The 1991 Thurrock Borough Council election took place on 2 May 1991 to elect members of Thurrock Borough Council in Essex, England.[1] This was on the same day as other local elections in England.
Summary
Election result
| 1991 Thurrock Borough Council election[2] | ||||||||||
|---|---|---|---|---|---|---|---|---|---|---|
| Party | This election | Full council | This election | |||||||
| Seats | Net | Seats % | Other | Total | Total % | Votes | Votes % | +/− | ||
| Labour | 10 | 76.9 | 23 | 33 | 84.6 | 16,826 | 53.4 | –9.3 | ||
| Conservative | 3 | 23.1 | 3 | 6 | 15.4 | 12,463 | 39.5 | +9.8 | ||
| Independent | 0 | 0.0 | 0 | 0 | 0.0 | 1,762 | 5.6 | +0.6 | ||
| Liberal Democrats | 0 | 0.0 | 0 | 0 | 0.0 | 480 | 1.5 | N/A | ||
Ward results
Aveley
| Party | Candidate | Votes | % | ±% | |
|---|---|---|---|---|---|
| Labour | A. Clarke | 889 | 40.0 | –9.8 | |
| Independent | E. Vellacott | 843 | 38.0 | +8.4 | |
| Conservative | L. Glover | 488 | 22.0 | +1.5 | |
| Majority | 46 | 2.1 | –18.1 | ||
| Turnout | 2,220 | 38.4 | –10.1 | ||
| Registered electors | 5,777 | ||||
| Labour hold | Swing | ||||
Belhus
| Party | Candidate | Votes | % | ±% | |
|---|---|---|---|---|---|
| Labour | P. Maynard* | 1,004 | 52.3 | –24.1 | |
| Conservative | D. Davies | 492 | 25.7 | +2.1 | |
| Independent | P. Perrin | 422 | 22.0 | N/A | |
| Majority | 512 | 26.7 | –26.1 | ||
| Turnout | 1,918 | 33.9 | –6.4 | ||
| Registered electors | 5,657 | ||||
| Labour hold | Swing | ||||
Chadwell St Mary
| Party | Candidate | Votes | % | ±% | |
|---|---|---|---|---|---|
| Labour | C. Bidmead* | 1,834 | 71.1 | –5.5 | |
| Conservative | I. Bodley | 746 | 28.9 | +5.5 | |
| Majority | 1,088 | 42.2 | –11.0 | ||
| Turnout | 2,580 | 34.6 | –10.3 | ||
| Registered electors | 7,462 | ||||
| Labour hold | Swing | ||||
Corringham & Fobbing
| Party | Candidate | Votes | % | ±% | |
|---|---|---|---|---|---|
| Labour | C. Morris* | 1,680 | 52.6 | –6.1 | |
| Conservative | S. Andrews | 1,511 | 47.4 | +6.1 | |
| Majority | 169 | 5.3 | –12.2 | ||
| Turnout | 3,191 | 33.9 | –7.5 | ||
| Registered electors | 9,419 | ||||
| Labour hold | Swing | ||||
Grays Thurrock (Town)
| Party | Candidate | Votes | % | ±% | |
|---|---|---|---|---|---|
| Labour | S. Josling* | 1,400 | 54.4 | –6.4 | |
| Conservative | J. Carter | 947 | 36.8 | +9.5 | |
| Independent | R. Holcombe | 228 | 8.9 | N/A | |
| Majority | 453 | 17.6 | –16.0 | ||
| Turnout | 2,575 | 32.0 | –6.4 | ||
| Registered electors | 8,040 | ||||
| Labour hold | Swing | ||||
Little Thurrock
| Party | Candidate | Votes | % | ±% | |
|---|---|---|---|---|---|
| Conservative | D. Sutton | 1,858 | 54.8 | +12.7 | |
| Labour | P. Betts | 1,532 | 45.2 | –2.7 | |
| Majority | 326 | 9.6 | N/A | ||
| Turnout | 3,390 | 39.1 | –8.1 | ||
| Registered electors | 8,666 | ||||
| Conservative hold | Swing | ||||
Ockendon
| Party | Candidate | Votes | % | ±% | |
|---|---|---|---|---|---|
| Labour | M. Jones* | 1,403 | 63.6 | –9.0 | |
| Conservative | H. Cook | 804 | 36.4 | +9.0 | |
| Majority | 599 | 27.1 | –18.1 | ||
| Turnout | 2,207 | 35.2 | –12.0 | ||
| Registered electors | 6,269 | ||||
| Labour hold | Swing | ||||
Orsett
| Party | Candidate | Votes | % | ±% | |
|---|---|---|---|---|---|
| Conservative | J. Mortimer | 1,154 | 72.1 | +41.8 | |
| Labour | M. Ware | 447 | 27.9 | –30.5 | |
| Majority | 707 | 44.2 | N/A | ||
| Turnout | 1,601 | 42.1 | –10.0 | ||
| Registered electors | 3,802 | ||||
| Conservative hold | Swing | ||||
Stanford-le-Hope
| Party | Candidate | Votes | % | ±% | |
|---|---|---|---|---|---|
| Labour | R. Harper* | 1,470 | 49.0 | –17.0 | |
| Conservative | M. Dalton | 1,049 | 35.0 | +1.0 | |
| Liberal Democrats | S. Senior | 480 | 16.0 | N/A | |
| Majority | 421 | 14.0 | –18.0 | ||
| Turnout | 2,999 | 38.1 | –5.7 | ||
| Registered electors | 7,866 | ||||
| Labour hold | Swing | ||||
Stifford
| Party | Candidate | Votes | % | ±% | |
|---|---|---|---|---|---|
| Labour | P. Giles | 1,415 | 51.5 | –5.7 | |
| Conservative | L. Brown | 1,334 | 48.5 | +5.7 | |
| Majority | 81 | 2.9 | –11.4 | ||
| Turnout | 2,749 | 43.1 | –12.3 | ||
| Registered electors | 6,373 | ||||
| Labour gain from Conservative | Swing | ||||
The Homesteads
| Party | Candidate | Votes | % | ±% | |
|---|---|---|---|---|---|
| Conservative | R. Bodley* | 1,116 | 52.8 | +10.0 | |
| Labour | A. Fish | 999 | 47.2 | –10.0 | |
| Majority | 117 | 5.5 | N/A | ||
| Turnout | 2,115 | 35.0 | –7.0 | ||
| Registered electors | 6,044 | ||||
| Conservative hold | Swing | ||||
Tilbury
| Party | Candidate | Votes | % | ±% | |
|---|---|---|---|---|---|
| Labour | J. Dunn* | 1,666 | 72.1 | –7.1 | |
| Conservative | M. Bamford-Burst | 376 | 16.3 | +4.3 | |
| Independent | J. Moore | 269 | 11.6 | +2.8 | |
| Majority | 1,290 | 55.8 | –11.4 | ||
| Turnout | 2,311 | 27.7 | –10.8 | ||
| Registered electors | 8,344 | ||||
| Labour hold | Swing | ||||
West Thurrock
| Party | Candidate | Votes | % | ±% | |
|---|---|---|---|---|---|
| Labour | G. Hawkins | 1,087 | 64.9 | +7.5 | |
| Conservative | P. Raven | 588 | 35.1 | N/A | |
| Majority | 499 | 29.8 | +14.9 | ||
| Turnout | 1,675 | 32.7 | –9.9 | ||
| Registered electors | 5,127 | ||||
| Labour gain from Independent | |||||
References
- ^ "Thurrock Borough Council Election Results 1973-1996" (PDF). Colin Rallings and Michael Thrasher. The Elections Centre, Plymouth University. Retrieved 29 January 2025.
- ^ "Council composition calculator". Colin Rallings and Michael Thrasher. The Elections Centre, Plymouth University. Retrieved 29 January 2025.
| Metropolitan boroughs |
|
|---|---|
| District councils (England) |
|
| District councils (Wales) |
|