Tendring District Council elections
Tendring District Council in Essex, England is elected every four years.
Council elections
| Year | Conservative | Labour | Liberal Democrats[a] | UKIP | Tendring First | Community Rep. |
Independents & Others |
Council control after election | |
|---|---|---|---|---|---|---|---|---|---|
| Local government reorganisation; council established (60 seats) | |||||||||
| 1973 | 31 | 11 | 4 | – | – | – | 14 | Conservative | |
| New ward boundaries[1] | |||||||||
| 1976 | 39 | 3 | 5 | – | – | – | 13 | Conservative | |
| 1979 | 39 | 4 | 7 | – | – | – | 10 | Conservative | |
| 1983 | 32 | 8 | 8 | – | – | – | 12 | Conservative | |
| 1987 | 33 | 4 | 15 | – | – | – | 8 | Conservative | |
| 1991 | 18 | 11 | 20 | – | – | – | 11[b] | No overall control | |
| 1995 | 8 | 37 | 7 | 0 | – | – | 8[c] | Labour | |
| 1999 | 16 | 23 | 9 | 0 | – | – | 12[d] | No overall control | |
| New ward boundaries | |||||||||
| 2003 | 25 | 11 | 13 | 0 | – | 4 | 7[e] | No overall control | |
| 2007 | 28 | 6 | 6 | 0 | 10 | 5 | 5[f] | No overall control | |
| 2011 | 33 | 9 | 2 | 0 | 8 | – | 8[g] | Conservative | |
| 2015 | 23 | 4 | 1 | 22 | 1 | – | 9[h] | No overall control | |
| New ward boundaries; seats decreased from 60 to 47[2] | |||||||||
| 2019 | 16 | 6 | 2 | 5 | 4 | – | 15[i] | No overall control | |
| 2023 | 19 | 8 | 4 | 0 | 1 | – | 16 | No overall control | |
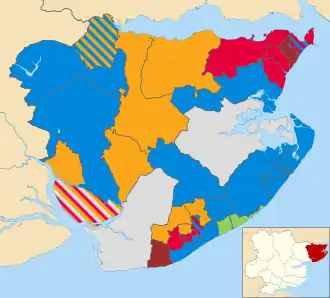
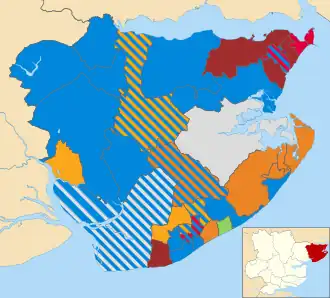
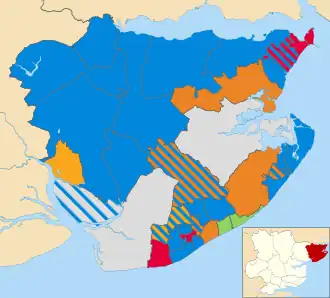
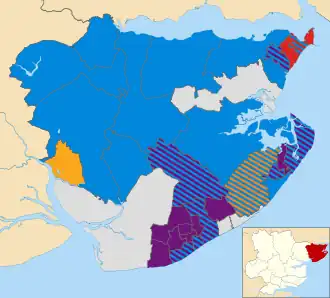
Results maps
-
 2003 results map
 -
 2007 results map
 -
 2011 results map
 -
 2015 results map
 -
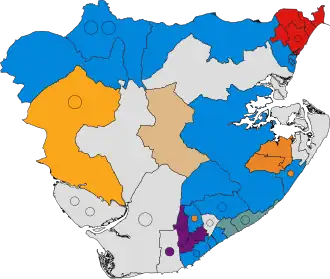 2019 results map
 -
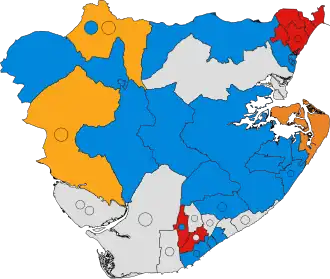 2023 results map
By-election results
1995-1999
| Party | Candidate | Votes | % | ±% | |
|---|---|---|---|---|---|
| Residents | 655 | 62.3 | |||
| Conservative | 221 | 21.0 | |||
| Labour | 142 | 13.5 | |||
| Liberal Democrats | 33 | 3.1 | |||
| Majority | 434 | 41.3 | |||
| Turnout | 1,051 | 39.3 | |||
| Independent hold | Swing | ||||
| Party | Candidate | Votes | % | ±% | |
|---|---|---|---|---|---|
| Conservative | 352 | 39.5 | +7.3 | ||
| Labour | 321 | 36.0 | −13.4 | ||
| Liberal Democrats | 219 | 24.6 | +6.2 | ||
| Majority | 31 | 3.5 | |||
| Turnout | 892 | 17.2 | |||
| Conservative gain from Labour | Swing | ||||
| Party | Candidate | Votes | % | ±% | |
|---|---|---|---|---|---|
| Labour | 340 | 50.1 | −18.0 | ||
| Conservative | 151 | 22.3 | +22.3 | ||
| Independent Labour | 103 | 15.2 | +15.2 | ||
| Liberal Democrats | 84 | 12.4 | +12.4 | ||
| Majority | 189 | 27.8 | |||
| Turnout | 678 | 27.5 | |||
| Labour hold | Swing | ||||
1999-2003
| Party | Candidate | Votes | % | ±% | |
|---|---|---|---|---|---|
| Labour | 473 | 52.3 | −2.7 | ||
| Conservative | 324 | 35.8 | +2.4 | ||
| Liberal Democrats | 108 | 11.9 | +0.4 | ||
| Majority | 149 | 16.5 | |||
| Turnout | 905 | 21.0 | |||
| Labour hold | Swing | ||||
| Party | Candidate | Votes | % | ±% | |
|---|---|---|---|---|---|
| Labour | 374 | 50.7 | +4.7 | ||
| Conservative | 174 | 23.6 | −4.2 | ||
| Community Representative | 95 | 12.9 | +12.9 | ||
| Liberal Democrats | 94 | 12.8 | −13.4 | ||
| Majority | 200 | 27.1 | |||
| Turnout | 737 | 19.0 | |||
| Labour hold | Swing | ||||
| Party | Candidate | Votes | % | ±% | |
|---|---|---|---|---|---|
| Liberal Democrats | 188 | 39.4 | +8.7 | ||
| Labour | 165 | 34.6 | +1.5 | ||
| Conservative | 124 | 26.0 | +26.0 | ||
| Majority | 23 | 4.8 | |||
| Turnout | 477 | 15.0 | |||
| Liberal Democrats gain from Labour | Swing | ||||
| Party | Candidate | Votes | % | ±% | |
|---|---|---|---|---|---|
| Independent | 332 | 51.1 | −25.5 | ||
| Labour | 238 | 36.6 | +19.2 | ||
| Conservative | 80 | 12.3 | +12.3 | ||
| Majority | 94 | 14.5 | |||
| Turnout | 650 | 22.0 | |||
| Labour hold | Swing | ||||
| Party | Candidate | Votes | % | ±% | |
|---|---|---|---|---|---|
| Liberal Democrats | Garry Scott | 347 | 44.0 | +44.0 | |
| Conservative | 281 | 35.7 | −13.6 | ||
| Labour | 160 | 20.3 | −30.4 | ||
| Majority | 66 | 8.3 | |||
| Turnout | 788 | 26.1 | |||
| Liberal Democrats gain from Labour | Swing | ||||
| Party | Candidate | Votes | % | ±% | |
|---|---|---|---|---|---|
| Liberal Democrats | 780 | 46.0 | +4.9 | ||
| Conservative | 514 | 30.3 | +10.9 | ||
| Labour | 403 | 23.7 | +0.0 | ||
| Majority | 266 | 15.7 | |||
| Turnout | 1,697 | 28.2 | |||
| Liberal Democrats hold | Swing | ||||
2003-2007
| Party | Candidate | Votes | % | ±% | |
|---|---|---|---|---|---|
| Conservative | 205 | 30.5 | −17.4 | ||
| Labour | 154 | 22.9 | −16.2 | ||
| UKIP | 109 | 16.2 | +16.2 | ||
| Liberal Democrats | 102 | 15.2 | +15.2 | ||
| Community Candidate | 102 | 15.2 | +15.2 | ||
| Majority | 51 | 7.6 | |||
| Turnout | 672 | 19.4 | |||
| Conservative hold | Swing | ||||
| Party | Candidate | Votes | % | ±% | |
|---|---|---|---|---|---|
| Conservative | 577 | 55.1 | +2.8 | ||
| Liberal Democrats | 345 | 32.9 | −14.8 | ||
| Labour | 125 | 12.0 | +12.0 | ||
| Majority | 232 | 22.6 | |||
| Turnout | 1,047 | 28.5 | |||
| Conservative hold | Swing | ||||
2007-2011
| Party | Candidate | Votes | % | ±% | |
|---|---|---|---|---|---|
| Conservative | Pam Sambridge | 455 | 55.2 | −10.5 | |
| Liberal Democrats | Joyce O'Brien | 227 | 27.5 | +15.7 | |
| Labour | Max Morris | 90 | 10.9 | +1.1 | |
| Green | Chris Southall | 52 | 6.3 | +6.3 | |
| Majority | 228 | 27.7 | |||
| Turnout | 824 | 46.0 | |||
| Conservative hold | Swing | ||||
| Party | Candidate | Votes | % | ±% | |
|---|---|---|---|---|---|
| Labour | Dan Casey | 409 | 28.2 | −0.8 | |
| Conservative | John Chittock | 404 | 27.9 | +8.6 | |
| Tendring First | Louise Stanley | 313 | 21.6 | −21.8 | |
| BNP | Keith Beaumont | 139 | 9.6 | +9.6 | |
| Independent | Christopher Judd | 120 | 8.3 | +8.3 | |
| Liberal Democrats | John Candler | 63 | 4.4 | +4.4 | |
| Majority | 5 | 0.3 | |||
| Turnout | 1,448 | 36.6 | |||
| Labour gain from Tendring First | Swing | ||||
2015-2019
| Party | Candidate | Votes | % | ±% | |
|---|---|---|---|---|---|
| UKIP | Richard Everett | 338 | 38.5% | ||
| Conservative | Danny Mayzes | 290 | 33.1% | ||
| Labour | Samantha Atkinson | 213 | 24.3% | ||
| Independent | William Hones | 36 | 4.1% | new | |
| Majority | |||||
| Turnout | 877 | 24.8% | |||
| UKIP hold | Swing | ||||
| Party | Candidate | Votes | % | ±% | |
|---|---|---|---|---|---|
| UKIP | Michael Bush | 216 | 36.8 | ||
| Conservative | Andrew Erskine | 171 | 29.1 | ||
| Labour | Robert Shephard | 117 | 19.9 | ||
| Liberal Democrats | Matthew Bensilum | 83 | 14.1 | N/A | |
| Majority | |||||
| Turnout | 39.3 | ||||
| UKIP gain from Independent | Swing | ||||
| Party | Candidate | Votes | % | ±% | |
|---|---|---|---|---|---|
| Conservative | Maurice Alexander | 371 | 47.9 | ||
| UKIP | Teresa O'Hara | 174 | 22.5 | ||
| Labour | Wendy Brown | 116 | 15.0 | ||
| Liberal Democrats | Sean Duffy | 99 | 12.8 | N/A | |
| Green | Rosemary Dodds | 15 | 1.9 | N/A | |
| Majority | 197 | 25.4 | |||
| Turnout | 777 | 23 | |||
| Conservative gain from UKIP | Swing | ||||
| Party | Candidate | Votes | % | ±% | |
|---|---|---|---|---|---|
| Conservative | Sue Honeywood | 378 | 39.5 | ||
| Independent | Stephen Andrews | 160 | 16.7 | ||
| Independent | William Hones | 134 | 14.0 | ||
| Labour | Rosie-Roella Kevlin | 114 | 11.9 | ||
| Liberal Democrats | Keith Pitkin | 79 | 8.3 | ||
| UKIP | Mike Vaughan-Chatfield | 71 | 7.4 | ||
| Green | Robert Cockroft | 20 | 2.1 | ||
| Majority | 218 | 22.8 | |||
| Turnout | 956 | ||||
| Conservative gain from UKIP | Swing | ||||
2019-2023
| Party | Candidate | Votes | % | ±% | |
|---|---|---|---|---|---|
| Independent | Andy Baker | 414 | 45.9 | ||
| Conservative | Mick Skeels | 294 | 32.6 | ||
| Holland Residents | Rick Speller | 118 | 13.1 | ||
| Labour | Simon Wigley | 44 | 4.9 | ||
| Independent | Danny Mayzes | 18 | 2.0 | ||
| Liberal Democrats | Mary Pitkin | 13 | 1.4 | ||
| Majority | 120 | 13.3 | |||
| Turnout | 901 | ||||
| Independent gain from Holland Residents | Swing | ||||
| Party | Candidate | Votes | % | ±% | |
|---|---|---|---|---|---|
| Conservative | Jayne Nash | 500 | 41.7 | ||
| Independent | Brad Thompson | 395 | 33.0 | ||
| Tendring First | Andy White | 140 | 11.7 | ||
| Labour | James Machin | 110 | 9.2 | ||
| Independent | Andy Wood | 32 | 2.7 | ||
| Liberal Democrats | Stuart Morgan | 21 | 1.8 | ||
| Majority | 105 | 8.8 | |||
| Turnout | 1,198 | ||||
| Conservative gain from UKIP | Swing | ||||
2023-2027
| Party | Candidate | Votes | % | ±% | |
|---|---|---|---|---|---|
| Independent | Bernard Goldman | 181 | 30.4 | ||
| Conservative | Alex Porter | 91 | 15.3 | ||
| Labour | John Carrington | 83 | 13.9 | ||
| Reform UK | Tony Mack | 54 | 9.1 | ||
| Independent | Danny Mayzes | 52 | 8.7 | ||
| Independent | Gareth Bayford | 45 | 7.6 | ||
| UKIP | Andrew Pemberton | 38 | 6.4 | ||
| Independent | Josie Holland | 24 | 4.0 | ||
| Liberal Democrats | Kane Silver | 22 | 3.7 | ||
| Independent | John Chittock | 6 | 1.0 | ||
| Majority | 90 | 15.1 | |||
| Turnout | 596 | ||||
| Independent gain from Labour | Swing | ||||
| Party | Candidate | Votes | % | ±% | |
|---|---|---|---|---|---|
| Reform UK | Aimee Keteca | 432 | 45.3 | ||
| Liberal Democrats | Rachael Richards | 328 | 34.4 | ||
| Conservative | Neil Stock | 163 | 17.1 | ||
| Labour | Oli Mupenda | 31 | 3.2 | ||
| Majority | 104 | 10.9 | |||
| Turnout | 954 | ||||
| Reform UK gain from Conservative | Swing | ||||
Notes
- ^ Includes totals for the predecessors of the Liberal Democrats, the Liberal Party and SDP (both of which participated in the Alliance).
- ^ Including 4 Residents Association
- ^ Including 4 Residents Association
- ^ Including 3 Residents Association
- ^ Including 3 Residents Association
- ^ Including 2 Residents Association
- ^ Including 3 Residents Association
- ^ Including 3 Residents Association
- ^ Including 3 Residents Association, 1 Foundation
References
- ^ The District of Tendring (Electoral Arrangements) Order 1975
- ^ The Tendring (Electoral Changes) Order 2017
- ^ "Lib Dems excel in council polls". guardian.co.uk. 8 March 2002. Retrieved 28 September 2009.
- ^ "Tories celebrate Hackney council win". guardian.co.uk. 21 January 2005. Retrieved 28 September 2009.
- ^ "Widow wins her husband's council seat". Daily Gazette. 28 September 2009. Retrieved 28 September 2009.
- ^ "Labour gain narrow victory over Tories in crucial by-election". Daily Gazette. 8 April 2010. Retrieved 9 April 2010.
- ^ "Declaration of results" (PDF). 6 April 2017.
- ^ "Local Elections Archive Project — St Pauls Ward". www.andrewteale.me.uk. Retrieved 22 September 2023.
- ^ "Local Elections Archive Project — Eastcliff Ward". www.andrewteale.me.uk. Retrieved 22 September 2023.
- ^ "Local Elections Archive Project — West Clacton and Jaywick Sands Ward". www.andrewteale.me.uk. Retrieved 22 September 2023.
- ^ "Local Elections Archive Project — Bluehouse Ward". www.andrewteale.me.uk. Retrieved 9 November 2024.
- ^ "New district councillor elected following by-election in The Bentleys and Frating ward". Tendring District Council. Retrieved 7 February 2025.
- By-election results Archived 29 March 2010 at the Wayback Machine