1984 Thurrock Borough Council election
| ||||||||||||||||||||||||||||||||||||||||||||||||||||||||||||||||||||
16 out of 39 seats to Thurrock Borough Council 20 seats needed for a majority | ||||||||||||||||||||||||||||||||||||||||||||||||||||||||||||||||||||
|---|---|---|---|---|---|---|---|---|---|---|---|---|---|---|---|---|---|---|---|---|---|---|---|---|---|---|---|---|---|---|---|---|---|---|---|---|---|---|---|---|---|---|---|---|---|---|---|---|---|---|---|---|---|---|---|---|---|---|---|---|---|---|---|---|---|---|---|---|
| Registered | 86,378 | |||||||||||||||||||||||||||||||||||||||||||||||||||||||||||||||||||
| Turnout | 25,552 29.6% ( | |||||||||||||||||||||||||||||||||||||||||||||||||||||||||||||||||||
| ||||||||||||||||||||||||||||||||||||||||||||||||||||||||||||||||||||
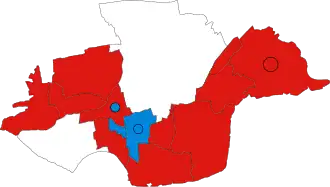 Winner of each seat at the 1984 Thurrock Borough Council election. | ||||||||||||||||||||||||||||||||||||||||||||||||||||||||||||||||||||
| ||||||||||||||||||||||||||||||||||||||||||||||||||||||||||||||||||||
The 1984 Thurrock Borough Council election took place on 3 May 1984 to elect members of Thurrock Borough Council in Essex, England.[1] This was on the same day as other local elections in England.
Summary
Election result
| 1984 Thurrock Borough Council election[2] | ||||||||||
|---|---|---|---|---|---|---|---|---|---|---|
| Party | This election | Full council | This election | |||||||
| Seats | Net | Seats % | Other | Total | Total % | Votes | Votes % | +/− | ||
| Labour | 12 | 75.0 | 15 | 27 | 69.2 | 17,079 | 53.5 | +2.7 | ||
| Conservative | 4 | 25.0 | 6 | 10 | 25.6 | 10,915 | 34.2 | –1.5 | ||
| Independent Labour | 0 | 0.0 | 2 | 2 | 5.1 | N/A | N/A | –2.8 | ||
| Independent | 0 | 0.0 | 0 | 0 | 0.0 | 1,906 | 6.0 | +3.2 | ||
| Alliance | 0 | 0.0 | 0 | 0 | 0.0 | 1,898 | 5.9 | –2.0 | ||
| Communist | 0 | 0.0 | 0 | 0 | 0.0 | 138 | 0.4 | N/A | ||
| Residents | 0 | 0.0 | 0 | 0 | 0.0 | N/A | N/A | N/A | ||
Ward results
Aveley
| Party | Candidate | Votes | % | ±% | |
|---|---|---|---|---|---|
| Labour | R. Lee | 1,053 | 61.6 | –6.5 | |
| Conservative | F. Beasley | 493 | 28.8 | –3.1 | |
| Alliance | J. Norris | 163 | 9.5 | N/A | |
| Majority | 560 | 32.8 | –3.5 | ||
| Turnout | 1,709 | 28.9 | –2.0 | ||
| Registered electors | 5,997 | ||||
| Labour hold | Swing | ||||
Belhus
| Party | Candidate | Votes | % | ±% | |
|---|---|---|---|---|---|
| Labour | J. Aberdein* | 1,137 | 77.9 | +1.0 | |
| Conservative | C. Clark | 322 | 22.1 | –1.0 | |
| Majority | 815 | 55.9 | +2.0 | ||
| Turnout | 1,459 | 24.2 | –3.6 | ||
| Registered electors | 6,125 | ||||
| Labour hold | Swing | ||||
Chadwell St Mary
| Party | Candidate | Votes | % | ±% | |
|---|---|---|---|---|---|
| Labour | P. Rice | 1,218 | 55.9 | +7.2 | |
| Independent | D. Hemmings* | 587 | 26.9 | +6.2 | |
| Conservative | V. Lanigan | 256 | 11.7 | –4.9 | |
| Alliance | A. Scott | 119 | 5.5 | N/A | |
| Majority | 631 | 28.9 | +1.0 | ||
| Turnout | 2,180 | 27.1 | –6.2 | ||
| Registered electors | 7,985 | ||||
| Labour gain from Independent | Swing | ||||
Corringham & Fobbing
| Party | Candidate | Votes | % | ||
|---|---|---|---|---|---|
| Labour | A. Price* | 1,465 | 63.3 | ||
| Labour | L. Boot | 1,382 | 59.7 | ||
| Conservative | J. Hubbard | 923 | 39.9 | ||
| Conservative | A. Whear | 857 | 37.0 | ||
| Turnout | ~2,356 | 24.8 | |||
| Registered electors | 9,499 | ||||
| Labour hold | |||||
| Labour hold | |||||
East Tilbury
| Party | Candidate | Votes | % | ±% | |
|---|---|---|---|---|---|
| Labour | B. Palmer | 1,075 | 70.2 | +44.6 | |
| Conservative | A. Grant | 457 | 29.8 | +15.1 | |
| Majority | 618 | 40.3 | N/A | ||
| Turnout | 1,532 | 36.1 | +3.5 | ||
| Registered electors | 4,271 | ||||
| Labour gain from Residents | Swing | ||||
Grays Thurrock (North)
| Party | Candidate | Votes | % | ±% | |
|---|---|---|---|---|---|
| Conservative | C. Hammett | 534 | 42.2 | –18.3 | |
| Labour | C. Olivier | 509 | 40.2 | +0.7 | |
| Alliance | A. Senior | 222 | 17.5 | N/A | |
| Majority | 25 | 2.0 | –19.0 | ||
| Turnout | 1,265 | 44.4 | +0.5 | ||
| Registered electors | 2,892 | ||||
| Conservative hold | Swing | ||||
Grays Thurrock (Town)
| Party | Candidate | Votes | % | ±% | |
|---|---|---|---|---|---|
| Labour | N. Paul | 830 | 38.5 | –29.5 | |
| Independent | B. Taylor | 714 | 33.1 | N/A | |
| Conservative | E. Attewell | 389 | 18.1 | –13.9 | |
| Alliance | P. Gray | 142 | 6.6 | N/A | |
| Communist | J. Paul | 79 | 3.7 | N/A | |
| Majority | 116 | 5.4 | –30.7 | ||
| Turnout | 2,154 | 32.6 | –1.5 | ||
| Registered electors | 6,675 | ||||
| Labour hold | |||||
Little Thurrock
| Party | Candidate | Votes | % | ||
|---|---|---|---|---|---|
| Conservative | A. Bennett | 1,146 | 50.7 | ||
| Conservative | P. Cleverly | 1,093 | 48.3 | ||
| Labour | J. Osman | 751 | 33.2 | ||
| Labour | L. Groombridge | 687 | 30.4 | ||
| Alliance | D. Benson | 467 | 20.6 | ||
| Alliance | G. Rice | 380 | 16.8 | ||
| Turnout | ~2,293 | 28.8 | |||
| Registered electors | 7,963 | ||||
| Conservative hold | |||||
| Conservative hold | |||||
Ockendon
| Party | Candidate | Votes | % | ±% | |
|---|---|---|---|---|---|
| Labour | A. Borge | 1,208 | 68.4 | +0.3 | |
| Conservative | J. Stone | 500 | 28.3 | –3.6 | |
| Communist | J. Walker | 59 | 3.3 | N/A | |
| Majority | 708 | 40.1 | +3.9 | ||
| Turnout | 1,767 | 26.6 | –5.0 | ||
| Registered electors | 6,720 | ||||
| Labour hold | Swing | ||||
Stanford-le-Hope
| Party | Candidate | Votes | % | ±% | |
|---|---|---|---|---|---|
| Labour | M. Meen* | 1,405 | 64.1 | +21.8 | |
| Conservative | G. Wood | 788 | 35.9 | +1.5 | |
| Majority | 617 | 28.1 | +20.2 | ||
| Turnout | 2,193 | 28.4 | –9.3 | ||
| Registered electors | 7,857 | ||||
| Labour hold | Swing | ||||
Stifford
| Party | Candidate | Votes | % | ||
|---|---|---|---|---|---|
| Labour | D. Scully | 1,247 | 49.1 | ||
| Conservative | E. Beardwell | 1,195 | 47.0 | ||
| Labour | M. Doyle | 1,187 | 46.7 | ||
| Conservative | M. Luff | 1,169 | 46.0 | ||
| Alliance | E. Ward | 284 | 11.2 | ||
| Turnout | ~3,200 | 48.9 | |||
| Registered electors | 6,544 | ||||
| Labour gain from Conservative | |||||
| Conservative hold | |||||
The Homesteads
| Party | Candidate | Votes | % | ±% | |
|---|---|---|---|---|---|
| Labour | A. Clarke* | 1,067 | 60.8 | +30.1 | |
| Conservative | D. Connelly | 689 | 39.2 | –7.6 | |
| Majority | 378 | 21.5 | N/A | ||
| Turnout | 1,756 | 31.0 | –8.3 | ||
| Registered electors | 5,744 | ||||
| Labour hold | Swing | ||||
Tilbury
| Party | Candidate | Votes | % | ±% | |
|---|---|---|---|---|---|
| Labour | G. Watts | 858 | 50.8 | –27.7 | |
| Independent | C. Spriggs | 605 | 35.8 | N/A | |
| Alliance | M. Bamford | 121 | 7.2 | –14.3 | |
| Conservative | W. McLaughlin | 104 | 6.2 | N/A | |
| Majority | 253 | 15.0 | –42.0 | ||
| Turnout | 1,688 | 21.1 | –5.3 | ||
| Registered electors | 8,106 | ||||
| Labour gain from Independent | |||||
References
- ^ "Thurrock Borough Council Election Results 1973-1996" (PDF). Colin Rallings and Michael Thrasher. The Elections Centre, Plymouth University. Retrieved 29 January 2025.
- ^ "Council composition calculator". Colin Rallings and Michael Thrasher. The Elections Centre, Plymouth University. Retrieved 29 January 2025.
| Metropolitan boroughs |
|
|---|---|
| District councils (England) |
|
| District councils (Scotland) |
|
| |