2006 Harlow District Council election
| |||||||||||||||||||||||||||||||||||||
12 of the 33 seats to Harlow District Council 17 seats needed for a majority | |||||||||||||||||||||||||||||||||||||
|---|---|---|---|---|---|---|---|---|---|---|---|---|---|---|---|---|---|---|---|---|---|---|---|---|---|---|---|---|---|---|---|---|---|---|---|---|---|
| |||||||||||||||||||||||||||||||||||||
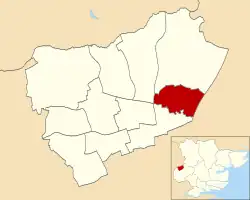
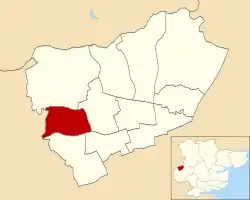
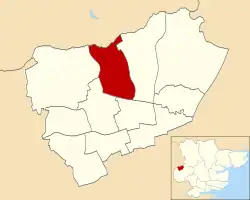
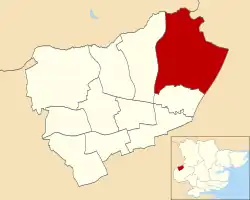
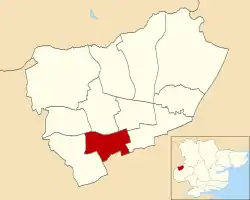
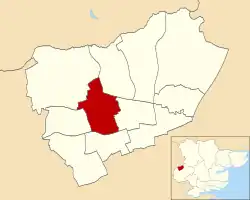
 Map showing the results of contested wards in the 2006 Harlow District Council elections. | |||||||||||||||||||||||||||||||||||||
| |||||||||||||||||||||||||||||||||||||
The 2006 Harlow District Council election took place on 4 May 2006 to elect members of Harlow District Council in Essex, England. One third of the council was up for election and the council stayed under no overall control.[1]
After the election, the composition of the council was
- Conservative 12
- Labour 11
- Liberal Democrats 10[2]
Election result
Overall turnout at the election was 36.93%.[3]
| Party | Seats | Gains | Losses | Net gain/loss | Seats % | Votes % | Votes | +/− | |
|---|---|---|---|---|---|---|---|---|---|
| Liberal Democrats | 5 | 1 | 0 | 41.7 | 25.8 | 5,606 | |||
| Conservative | 4 | 0 | 1 | 33.3 | 40.2 | 8,737 | |||
| Labour | 3 | 0 | 0 | 0 | 25.0 | 32.1 | 6,968 | ||
| Respect | 0 | 0 | 0 | 0 | 0 | 1.0 | 217 | ||
| Independent | 0 | 0 | 0 | 0 | 0 | 1.0 | 211 | ||
Ward results
Bush Fair

| Party | Candidate | Votes | % | ±% | |
|---|---|---|---|---|---|
| Liberal Democrats | Eleanor Macy | 995 | 48.7 | +16.6 | |
| Labour | Edna Stevens | 693 | 33.9 | −1.0 | |
| Conservative | Graham Smith | 357 | 17.5 | −0.3 | |
| Majority | 302 | 14.8 | |||
| Turnout | 2,045 | 39.1 | −1.1 | ||
| Liberal Democrats hold | Swing | ||||
Church Langley
| Party | Candidate | Votes | % | ±% | |
|---|---|---|---|---|---|
| Conservative | Samantha Warren | 1,387 | 73.3 | +11.7 | |
| Labour | Kenneth Lawrie | 298 | 15.8 | +0.3 | |
| Liberal Democrats | Robert Pailing | 206 | 10.9 | −12.0 | |
| Majority | 1,089 | 57.5 | +18.8 | ||
| Turnout | 1,891 | 32.0 | +1.5 | ||
| Conservative hold | Swing | ||||
Great Parndon
| Party | Candidate | Votes | % | ±% | |
|---|---|---|---|---|---|
| Conservative | Joshua Jolles | 960 | 51.1 | +11.1 | |
| Labour | Norman Knight | 608 | 32.4 | +0.8 | |
| Liberal Democrats | Ian Rideout | 309 | 16.5 | +5.2 | |
| Majority | 352 | 18.7 | +10.3 | ||
| Turnout | 1,877 | 38.6 | −0.3 | ||
| Conservative hold | Swing | ||||
Harlow Common

| Party | Candidate | Votes | % | ±% | |
|---|---|---|---|---|---|
| Labour | Margaret Hulcoop | 789 | 40.2 | +1.1 | |
| Conservative | Michelle Dorling | 706 | 35.9 | +3.3 | |
| Liberal Democrats | Alan Lawrence | 258 | 13.1 | +0.1 | |
| Independent | Gary Roberts | 211 | 10.7 | −4.6 | |
| Majority | 83 | 4.3 | −2.2 | ||
| Turnout | 1,964 | 38.4 | +0.3 | ||
| Labour hold | Swing | ||||
Little Parndon & Hare Street

| Party | Candidate | Votes | % | ±% | |
|---|---|---|---|---|---|
| Labour | Anthony Durcan | 743 | 43.2 | −3.5 | |
| Conservative | Lee Dangerfield | 613 | 35.6 | +4.0 | |
| Liberal Democrats | Richard Farnsworth | 365 | 21.2 | −0.5 | |
| Majority | 130 | 7.6 | −7.5 | ||
| Turnout | 1,721 | 35.5 | −1.7 | ||
| Labour hold | Swing | ||||
Mark Hall

| Party | Candidate | Votes | % | ±% | |
|---|---|---|---|---|---|
| Liberal Democrats | Robert Thurston | 761 | 37.0 | +8.6 | |
| Labour | Michael Danvers | 735 | 35.7 | −4.2 | |
| Conservative | Jane Steer | 562 | 27.3 | +8.8 | |
| Majority | 26 | 1.3 | |||
| Turnout | 2,058 | 43.7 | +0.8 | ||
| Liberal Democrats gain from Conservative | Swing | ||||
Netteswell
| Party | Candidate | Votes | % | ±% | |
|---|---|---|---|---|---|
| Liberal Democrats | Linda Pailing | 736 | 42.3 | +8.2 | |
| Labour | Feroz Khan | 555 | 31.9 | +7.6 | |
| Conservative | Valerie Gough | 448 | 25.8 | +11.7 | |
| Majority | 181 | 10.4 | +0.6 | ||
| Turnout | 1,739 | 35.5 | −0.9 | ||
| Liberal Democrats hold | Swing | ||||
Old Harlow
| Party | Candidate | Votes | % | ±% | |
|---|---|---|---|---|---|
| Conservative | Michael Garnett | 1,033 | 56.5 | +18.8 | |
| Labour | Paul Sztumpf | 477 | 26.1 | +1.1 | |
| Liberal Democrats | Nicholas Macy | 318 | 17.4 | +6.9 | |
| Majority | 556 | 30.4 | +19.6 | ||
| Turnout | 1,828 | 39.1 | −3.3 | ||
| Conservative hold | Swing | ||||
Staple Tye (2 seats)
| Party | Candidate | Votes | % | |
|---|---|---|---|---|
| Liberal Democrats | Lorna Spenceley | 629 | ||
| Liberal Democrats | Christopher Robins | 595 | ||
| Conservative | Clive Souter | 536 | ||
| Conservative | Mark Gough | 534 | ||
| Labour | Dennis Palmer | 388 | ||
| Labour | Jenny Holland | 386 | ||
| Turnout | 3,068 | |||
| Liberal Democrats hold | ||||
| Liberal Democrats hold | ||||
Sumners and Kingsmoor

| Party | Candidate | Votes | % | ±% | |
|---|---|---|---|---|---|
| Conservative | Nicholas Churchill | 842 | 54.0 | +8.0 | |
| Labour | Suzanne Ennifer | 484 | 31.1 | −5.5 | |
| Liberal Democrats | Kuzna Jackson | 232 | 14.9 | −2.4 | |
| Majority | 358 | 22.9 | +13.5 | ||
| Turnout | 1,558 | 31.0 | −2.5 | ||
| Conservative hold | Swing | ||||
Toddbrook
| Party | Candidate | Votes | % | ±% | |
|---|---|---|---|---|---|
| Labour | Roy Collyer | 812 | 40.8 | −1.4 | |
| Conservative | David Carter | 759 | 38.1 | +8.8 | |
| Respect | James Rogers | 217 | 10.9 | +10.9 | |
| Liberal Democrats | Paul Westlake | 202 | 10.2 | −2.1 | |
| Majority | 53 | 2.7 | −10.2 | ||
| Turnout | 1,990 | 40.6 | +5.2 | ||
| Labour hold | Swing | ||||
References
- ^ "Local elections: Harlow". BBC News. 5 May 2006. Retrieved 1 January 2015.
- ^ a b c d e f g h i j k l m "Harlow District Council Election Results 2006". Harlow District Council. Archived from the original on 6 February 2012. Retrieved 1 January 2015.
- ^ "Election Results 3rd May 2007". Harlow District Council. Archived from the original on 6 February 2012. Retrieved 1 January 2015.