Octon, Hérault
Octon | |
|---|---|
 The main square in Octon | |
.svg.png) Coat of arms | |
Location of Octon | |
 Octon 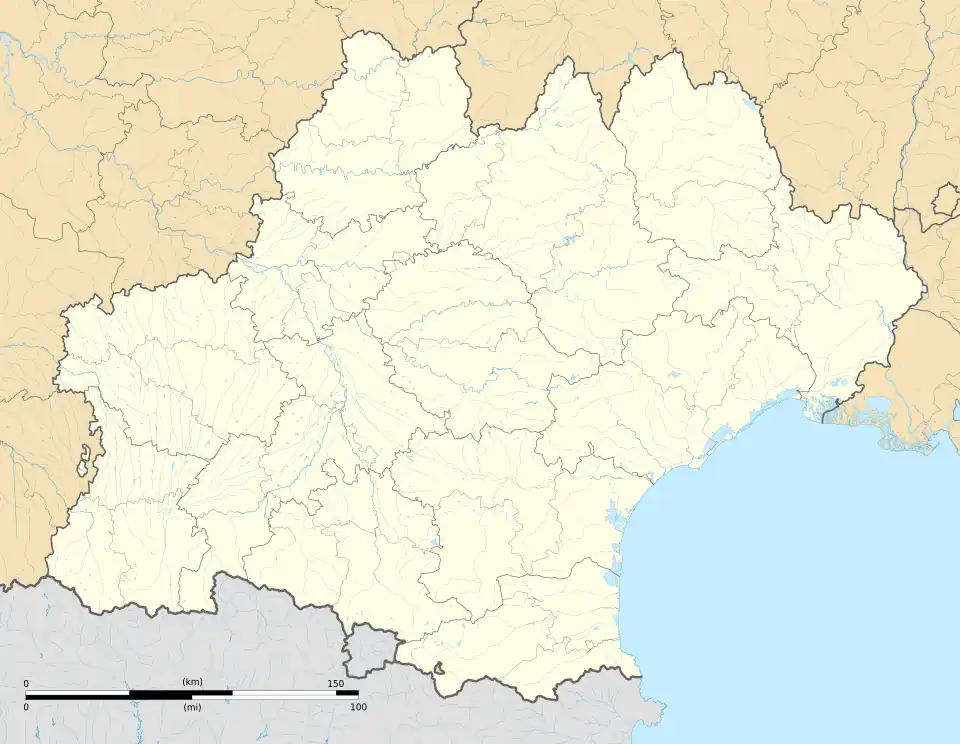 Octon | |
| Coordinates: 43°39′18″N 3°18′12″E / 43.655°N 3.3033°E | |
| Country | France |
| Region | Occitania |
| Department | Hérault |
| Arrondissement | Lodève |
| Canton | Clermont-l'Hérault |
| Intercommunality | Clermontais |
| Government | |
| • Mayor (2020–2026) | Bernard Coste[1] |
Area 1 | 21.81 km2 (8.42 sq mi) |
| Population (2022)[2] | 520 |
| • Density | 24/km2 (62/sq mi) |
| Time zone | UTC+01:00 (CET) |
| • Summer (DST) | UTC+02:00 (CEST) |
| INSEE/Postal code | 34186 /34800 |
| Elevation | 134–700 m (440–2,297 ft) (avg. 125 m or 410 ft) |
| 1 French Land Register data, which excludes lakes, ponds, glaciers > 1 km2 (0.386 sq mi or 247 acres) and river estuaries. | |
Octon (French pronunciation: [ɔktɔ̃]; Occitan: Auton) is a commune in the Hérault department in the Occitanie region in southern France.
Geography

Climate
Octon has a mediterranean climate (Köppen climate classification Csa). The average annual temperature in Octon is 14.9 °C (58.8 °F). The average annual rainfall is 942.8 mm (37.12 in) with October as the wettest month. The temperatures are highest on average in July, at around 23.7 °C (74.7 °F), and lowest in January, at around 7.2 °C (45.0 °F). The highest temperature ever recorded in Octon was 40.6 °C (105.1 °F) on 12 August 2003; the coldest temperature ever recorded was −7.2 °C (19.0 °F) on 28 February 2018.
| Climate data for Octon (1981–2010 averages, extremes 1998−present) | |||||||||||||
|---|---|---|---|---|---|---|---|---|---|---|---|---|---|
| Month | Jan | Feb | Mar | Apr | May | Jun | Jul | Aug | Sep | Oct | Nov | Dec | Year |
| Record high °C (°F) | 21.1 (70.0) |
22.4 (72.3) |
27.6 (81.7) |
31.9 (89.4) |
34.7 (94.5) |
39.8 (103.6) |
37.6 (99.7) |
40.6 (105.1) |
36.5 (97.7) |
31.8 (89.2) |
25.7 (78.3) |
21.1 (70.0) |
40.6 (105.1) |
| Mean daily maximum °C (°F) | 10.8 (51.4) |
11.7 (53.1) |
15.4 (59.7) |
18.5 (65.3) |
22.5 (72.5) |
27.5 (81.5) |
29.7 (85.5) |
29.3 (84.7) |
24.7 (76.5) |
19.5 (67.1) |
14.1 (57.4) |
11.1 (52.0) |
19.6 (67.3) |
| Daily mean °C (°F) | 7.2 (45.0) |
7.7 (45.9) |
10.8 (51.4) |
13.6 (56.5) |
17.4 (63.3) |
21.6 (70.9) |
23.7 (74.7) |
23.5 (74.3) |
19.4 (66.9) |
15.6 (60.1) |
10.5 (50.9) |
7.5 (45.5) |
14.9 (58.8) |
| Mean daily minimum °C (°F) | 3.7 (38.7) |
3.8 (38.8) |
6.1 (43.0) |
8.7 (47.7) |
12.2 (54.0) |
15.8 (60.4) |
17.8 (64.0) |
17.6 (63.7) |
14.2 (57.6) |
11.7 (53.1) |
6.9 (44.4) |
3.9 (39.0) |
10.2 (50.4) |
| Record low °C (°F) | −5.4 (22.3) |
−7.2 (19.0) |
−6.9 (19.6) |
1.7 (35.1) |
2.7 (36.9) |
8.1 (46.6) |
9.6 (49.3) |
11.1 (52.0) |
5.7 (42.3) |
−1.0 (30.2) |
−5.5 (22.1) |
−5.8 (21.6) |
−7.2 (19.0) |
| Average precipitation mm (inches) | 87.2 (3.43) |
86.1 (3.39) |
53.4 (2.10) |
86.8 (3.42) |
67.3 (2.65) |
43.3 (1.70) |
22.9 (0.90) |
43.0 (1.69) |
88.5 (3.48) |
144.5 (5.69) |
116.2 (4.57) |
103.6 (4.08) |
942.8 (37.12) |
| Average precipitation days (≥ 1.0 mm) | 7.5 | 6.3 | 5.7 | 7.0 | 6.4 | 4.6 | 2.5 | 3.9 | 5.0 | 7.6 | 6.7 | 6.8 | 69.9 |
| Source: Meteociel[3] | |||||||||||||
Population
| Year | Pop. | ±% |
|---|---|---|
| 1962 | 220 | — |
| 1968 | 253 | +15.0% |
| 1975 | 220 | −13.0% |
| 1982 | 243 | +10.5% |
| 1990 | 350 | +44.0% |
| 1999 | 397 | +13.4% |
| 2008 | 427 | +7.6% |
See also
References
- ^ "Répertoire national des élus: les maires". data.gouv.fr, Plateforme ouverte des données publiques françaises (in French). 2 December 2020.
- ^ "Populations de référence 2022" (in French). The National Institute of Statistics and Economic Studies. 19 December 2024.
- ^ "Normales et records pour Octon (34)". Meteociel. Retrieved 5 June 2022.
Wikimedia Commons has media related to Octon.